


This is a past report. It covers Fort Myers market data for August 2026. For current numbers, see our Fort Myers housing market page.
Fort Myers Price Per Square Foot Rose a Second Straight Month in August While the Median Sale Price Matched August 2025
Price / Sq Ft
$201
Median Sold Price
$345,000
Active Listings
2,447
Months of Supply
5.2
Fort Myers price per square foot reached $201 in August 2026, a second monthly increase in a row after $192 in June and $198 in July. The median sale price held level with a year earlier at $345,000.
The median sale price came in at $345,000, the same figure Fort Myers recorded in August 2025. Price per square foot rose for a second month but remained 2.9% below August 2025. That is a short-term improvement, not yet evidence that the longer decline has ended.
Pending contracts rose 21.4% year over year while active inventory fell 20.0%, and homes that returned to the market took far longer to sell than homes that sold on a first attempt. Regional context sits in the August 2026 Southwest Florida market report.
*Unless otherwise noted, housing-market figures come from the Florida Gulf Coast MLS (FGCMLS via Stellar MLS), pulled September 1, 2026. Data reflects MLS records as of the date the monthly analysis file was prepared. MLS figures may update as late transactions are recorded.*
Key Takeaways
- Fort Myers price per square foot reached $201 in August 2026, a second consecutive monthly increase from the June low of $192, and remains 2.9% below August 2025.
- The median sale price was $345,000, matching August 2025 for a year-over-year change of 0.0%.
- Pending sales rose 21.4% to 431.
- Active listings fell 20.0% to 2,447. Active counts move through completed sales, withdrawals, expirations and other status changes, so the decline reflects several forces at once.
- Published months of supply was 5.2, down from 7.5 a year earlier, and the supplemental Competitive Inventory view of fresher supply read 2.2 months.
Fort Myers Home Prices Steadied in August After a Long Run of Year-Over-Year Declines
The Fort Myers median sale price held level with August 2025, while price per square foot remained 2.9% lower. The median sale price of $345,000 matched August 2025 to the dollar, which put the year-over-year change at 0.0%. Price per square foot reached $201, up from $198 in July and $192 in June.
Price per square foot normalizes for home size. It usually moves less with the mix of homes that happen to close in a given month. Both measures moved up together in August.
Two months of improvement is where the evidence currently stands. Price per square foot remains 2.9% below August 2025 and below the $210 Fort Myers recorded in January. Several more months are needed before calling the recent improvement a sustained change.
Sellers received a median 95.7% of their most recent asking price, unchanged from both August 2025 and July 2026. That ratio describes where closings landed across the city as a whole. It is market context rather than a target for any individual offer, and a 95.7% reading carries no instruction to bid 4.3% under a specific asking price.
Contracts Rose While the Number of Homes for Sale Kept Falling
Buyers signed more contracts in Fort Myers this August than last August. Pending sales reached 431, up 21.4% from 355 a year earlier. Showings per listing rose to 3.3 from 3.2, and the median number of showings before a contract fell to 7 from 9 in July.
Closed sales went the other way, though. Fort Myers recorded 380 closings against 402 in August 2025, down 5.5%. Dollar volume came in at $152.0 million, down 8.6% year over year.
Those two counts describe different moments. A closing reflects a contract written weeks earlier, and a pending contract reflects activity during the month itself. August also falls inside Southwest Florida’s slower season, which runs May through September, so both counts sit in a period of reduced activity.
Active listings totaled 2,447 in August, down 20.0% from 3,059 a year earlier. New listings came in at 561, down 5.2%. The active count falls for several reasons at the same time, including completed sales, withdrawals and expirations. The size of the decline does not by itself establish how much of it came from buyers.
The Pending-to-Active Ratio was 22.1%. That figure compares homes under contract to homes available at the pull date. It is a snapshot of activity levels rather than a conversion rate, and it does not measure what buyers are paying.
Shadow inventory refers to homes whose owners have moved toward selling without an active MLS listing in place. Worthington reads this pool directionally rather than publishing a count, since a listing that left the MLS may have sold privately or come off for renovation. Of the Fort Myers listings that left the MLS in August 2026, roughly one in ten had returned by the pull date.
First-Attempt and Relisted Homes Performed Differently on Time and on Price
Across closings in the trailing 120 days through September 1, 2026, Fort Myers homes that sold on their first listing attempt had a median 66 days on market. Homes that eventually sold after relisting accumulated a median 246 days across their listing attempts. Those figures cover 1,524 and 334 closings respectively in the trailing 120 days.
Homes that sold on a first listing attempt had a median sale price of $337,000. Homes that returned to the market opened at a median $357,000 and closed at a median $316,000, a median per-home difference of $44,750. Relisted homes made up 17.8% of trailing 120-day closings.
Those are descriptive figures for two populations of homes. First-attempt and relisted homes differ in price, property type, condition and seller circumstances. The data shows how each group performed, and it does not establish that relisting or the opening price produced the difference between them.
Fort Myers carried a Re-list Rate of 23.9%. The Fort Myers rate has fallen in each of the last two months, from 25.8% in June to 24.6% in July. A lower Re-list Rate means fewer active homes carry an expired, withdrawn or terminated listing at the same address from the previous 12 months. The data does not establish why those earlier listings ended. That covers 575 of the 2,408 active listings in the address-matched export with an expired, withdrawn or terminated record in the trailing 12 months. Of those returning listings, 57.2% came back at 3% or more below the prior asking price, and 42.8% were relisted with little or no price change.
When a home returns to the MLS under a new listing, its days-on-market counter starts over at zero. The days-on-market number shown on an active listing may not reflect its cumulative marketing time across listing attempts.
For Fort Myers sellers
Curious what your Fort Myers home would bring in today’s market?
Get a Worthington pricing analysis built from the same MLS data behind this report.
Fort Myers Months of Supply, Competitive Inventory and Ask-Bid Gap
Published months of supply for Fort Myers was 5.2 in August 2026, down 30.7% from 7.5 a year earlier. The calculation divides current active listings by a 12-month sales pace. It answers a single question: at that pace, how long would it take to sell through what is listed today. Pending contracts are not part of the calculation.
Season matters when reading it. Southwest Florida’s peak buying period runs January through April, the reverse of most of the country, and activity thins from May into September. The same figure in February would describe a market with more buyers in it, so the year-over-year comparison carries more meaning than the month-to-month move.
Competitive Inventory is Worthington’s filtered view of active listings. It sets aside homes that have been listed at least 180 days without a price reduction of 3% or more, along with relisted homes that returned with less than a 3% change. It uses the city’s three-month closing pace, while published MLS months of supply uses all active listings and a 12-month pace. The two figures answer different questions and should not be read as interchangeable.
On Fort Myers’ trailing three-month pace of 455.3 closings a month, all 2,408 export listings read 5.3 months. Setting aside the 550 listings past the 180-day mark brings that to 4.1 months. The full filter leaves 1,002 listings at 2.2 months.
The Ask-Bid Gap compares two medians. The first is the asking price per square foot of active listings. The second is the price per square foot of recent closings in the same price range. Fort Myers ran 4.9% citywide, with active listings asking $208.89 against $198.61 achieved across trailing 120-day closings.
By price range, the Ask-Bid Gap was 5.9% under $400,000 and 5.7% from $400,000 to $750,000. It ran 1.6% from $750,000 to $1.5 million and 15.4% above $1.5 million. That top range rests on 89 active listings and 36 closings, a small sold sample for a single range.
The active homes and the sold homes are not the same properties. They can differ in condition, location, age and finish. This measure shows how closely the two groups line up at a point in time. It is not an offer discount, and it does not predict any individual home’s sale price or marketing time.
Table 1: Core Market Metrics, August 2026
Read this city’s figures against its own recent history.
| City | Median Sold Price | Median Price per Sq. Ft. | Active Listings | Months of Supply | Sold-to-List | Closed Sales YoY |
|---|---|---|---|---|---|---|
| Fort Myers | $345,000 (0.0%) | $201 (-2.9%) | 2,447 (-20.0%) | 5.2 (-30.7%) | 95.7% | -5.5% |
| Cape Coral | $382,375 (+6.8%) | $222 (+3.3%) | 2,441 (-22.4%) | 4.8 (-31.4%) | 97.7% | -5.0% |
| Estero | $517,500 (+6.2%) | $250 (0.0%) | 441 (-32.5%) | 3.5 (-44.4%) | 95.9% | -2.2% |
| Bonita Springs | $505,000 (+0.5%) | $287 (-2.0%) | 668 (-30.2%) | 4.3 (-41.1%) | 95.1% | -14.8% |
| Naples | $610,000 (+1.7%) | $328 (+1.5%) | 3,858 (-23.2%) | 5.2 (-35.0%) | 95.5% | -5.8% |
Source: FGCMLS. Single-month data unless otherwise noted. Sold-to-list uses most recent list price at time of contract.
Table 2: Worthington Market Lens, August 2026
| City | Competitive Inventory (Months) | Re-list Rate | Ask-Bid Gap (PPSF%) | Pending-to-Active Ratio | First-Attempt Median DOM | Median Total DOM After Relisting |
|---|---|---|---|---|---|---|
| Fort Myers | 2.2 | 23.9% | 4.9% | 22.1% | 66 days | 246 days |
| Cape Coral | 2.1 | 19.8% | 5.2% | 26.5% | 48 days | 219 days |
| Estero | 1.9 | 20.1% | 4.0% | 31.6% | 63 days | 240 days |
| Bonita Springs | 1.9 | 22.3% | 16.0% | 22.6% | 82 days | 256 days |
| Naples | 1.9 | 23.4% | 7.1% | 21.6% | 74 days | 258 days |
Source: FGCMLS. Single-month data unless otherwise noted. Proprietary metrics use Worthington’s address-matched property export, so active-listing denominators differ slightly from the published MLS counts in Table 1. Competitive Inventory MOI divides the filtered active-listing count by the city’s total trailing-three-month closing pace. It is a supplemental indicator and is not calculated the same way as published MLS months of supply.
August 2026 Opening-Price Results for Fort Myers Communities
The final line in each profile compares eligible August closings with the opening asking price of the listings that sold. Results are calculated property by property before the median is reported. Sample sizes appear with every result, and small samples describe only those particular sales.
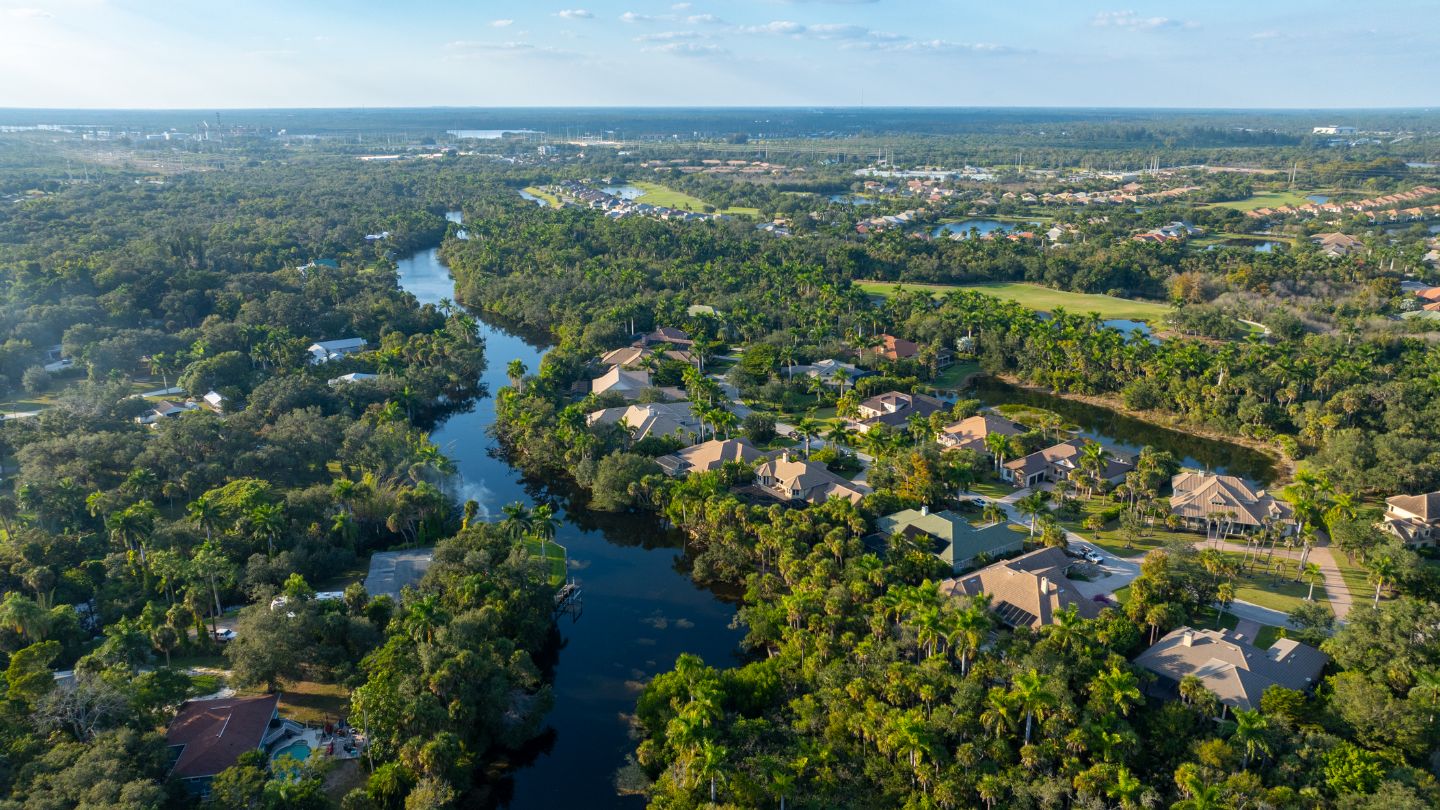
Verandah
The six August closings finished at a median 82.0% of the price those listings opened at, $86,000 below it, against 95.9% measured from the final asking price. The difference between the opening-price and final-ask results reflects asking-price changes made during the listings that produced those sales. Months of inventory moved from 4.3 to 5.8 on 36 active listings and 25 closings, with pending contracts at four. Pebblebrook and Otter Bend closings sat roughly $170,000 apart, so comparable selection belongs inside one neighborhood.
View 7 more indicators
- Closing Range (Last 120 Days)
- $210,500 to $945,000 across 25 sales
- Active Listings
- 36up 9.1% MoM
- Closings (Last 120 Days)
- 25down 19.4% MoM
- Pending Contracts
- 4down 55.6% MoM
- Re-list Rate
- 22.2%down 8.1 pts MoM
- Sellers Received
- 96.7% of final list priceup 0.7 pts MoM
- Sellers Received vs Original Ask
- 82.0% of the listing’s opening price (n=6), a median $86,000 below it
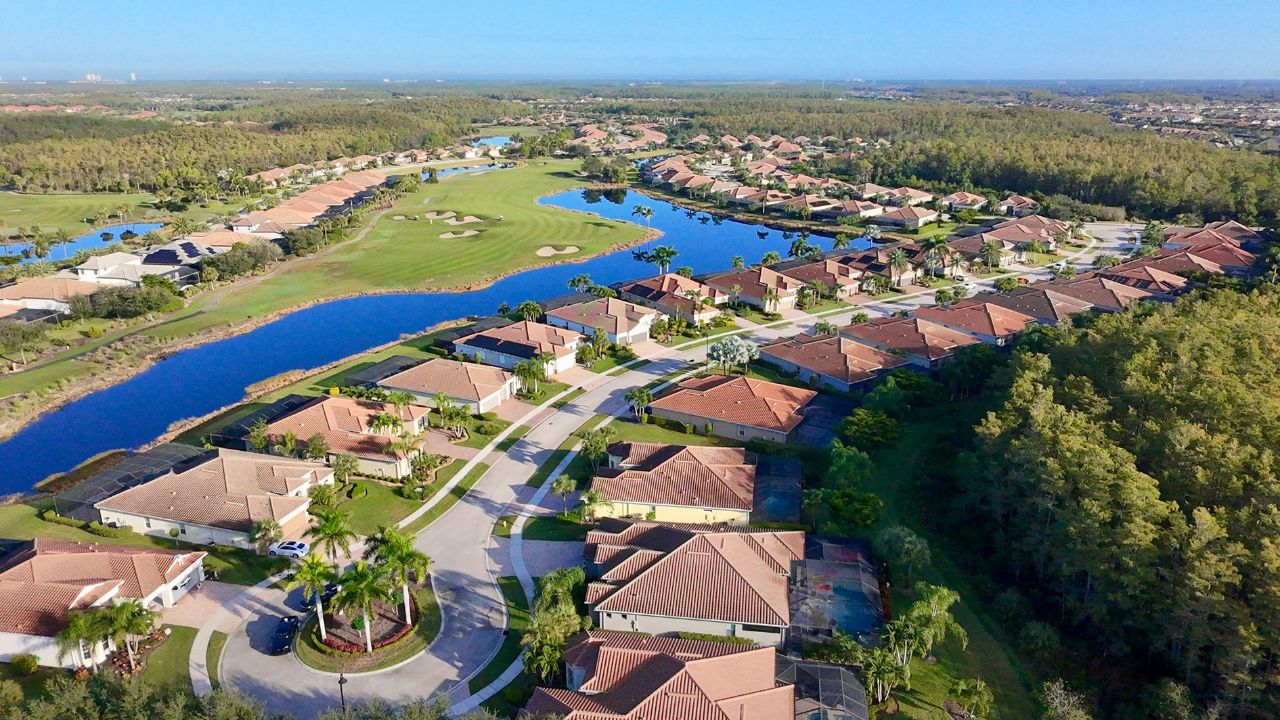
The Plantation
Two neighborhoods carry this community and they closed at different levels: Bridgetown at a $575,000 median across 21 sales, Somerset at $540,000 across 17. Months of inventory held at 2.5, with 24 active listings, five pending contracts and 38 closings across the trailing 120 days. The nine August closings finished at a median 91.1% of their opening price, $39,900 below it, against 97.8% from the final ask. One of the nine was a relist. Pricing here works from sales inside a single neighborhood, since the two have exchanged positions on median price twice this year.
View 7 more indicators
- Closing Range (Last 120 Days)
- $320,000 to $1,160,000 across 38 sales
- Active Listings
- 24down 7.7% MoM
- Closings (Last 120 Days)
- 38down 9.5% MoM
- Pending Contracts
- 5down 58.3% MoM
- Re-list Rate
- 20.8%down 10.0 pts MoM
- Sellers Received
- 96.4% of final list priceup 0.2 pts MoM
- Sellers Received vs Original Ask
- 91.1% of the listing’s opening price (n=9), a median $39,900 below it
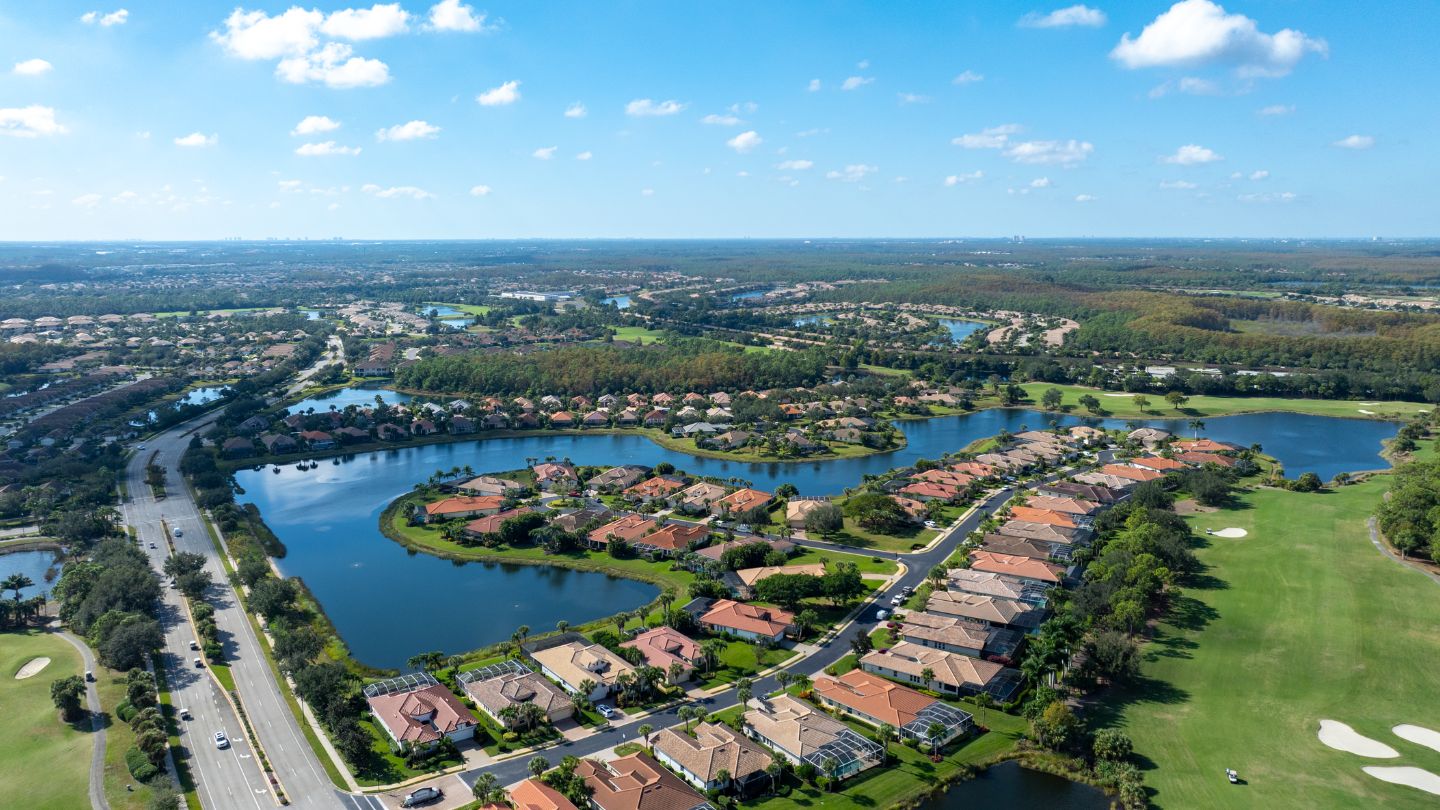
Pelican Preserve
Pelican Preserve is a 55-plus community. Buyers should confirm current occupancy requirements directly with the association. Asking and closing prices describe different homes here. The active pool asks a median $339,000 on stock running about 450 square feet smaller than the homes that sold at a $410,500 median. Months of inventory moved from 2.6 to 4.2 across 43 active listings and 41 closings. The eight August closings finished at a median 95.4% of their opening price, $34,500 below it, with one relist among them. Siena closed at $225,000 and Carena at $571,000 in the same window, so comparables belong inside a single neighborhood.
View 7 more indicators
- Closing Range (Last 120 Days)
- $209,500 to $865,000 across 41 sales
- Active Listings
- 43down 2.3% MoM
- Closings (Last 120 Days)
- 41down 38.8% MoM
- Pending Contracts
- 8down 20.0% MoM
- Re-list Rate
- 25.6%up 5.1 pts MoM
- Sellers Received
- 96.7% of final list priceup 0.1 pts MoM
- Sellers Received vs Original Ask
- 95.4% of the listing’s opening price (n=8), a median $34,500 below it
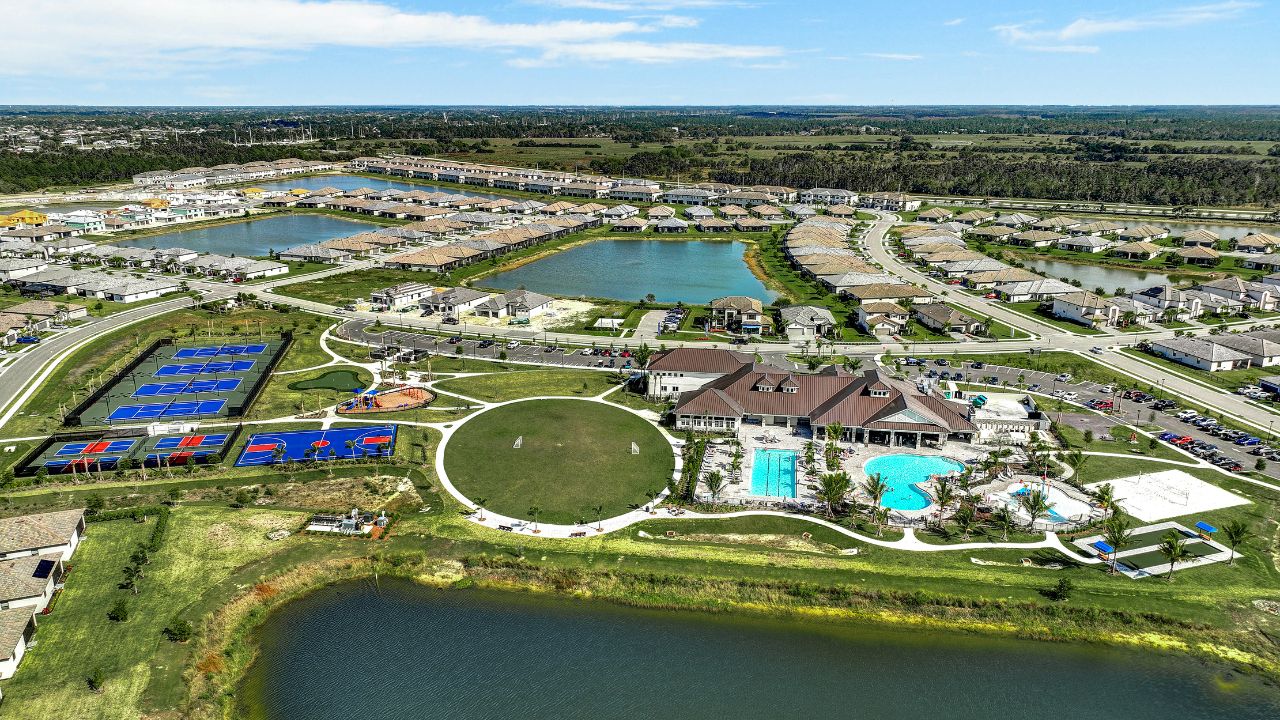
Timber Creek
Timber Creek’s pending-to-active ratio reached 47.8%, with 11 pending against 23 active listings and months of inventory at 3.2. The active pool asks a median $450,000, matching the closed median exactly on homes of the same median size. Three of the seven August closings were relists, and all seven finished at a median 94.2% of their opening price, $29,500 below it. Every home here dates from 2020 through 2025, so floor plan and lot position separate comparables more usefully than construction year.
View 7 more indicators
- Closing Range (Last 120 Days)
- $278,500 to $678,000 across 29 sales
- Active Listings
- 23down 17.9% MoM
- Closings (Last 120 Days)
- 29flat MoM
- Pending Contracts
- 11up 10.0% MoM
- Re-list Rate
- 39.1%up 10.5 pts MoM
- Sellers Received
- 97.4% of final list pricedown 0.2 pts MoM
- Sellers Received vs Original Ask
- 94.2% of the listing’s opening price (n=7), a median $29,500 below it
Lexington Country Club
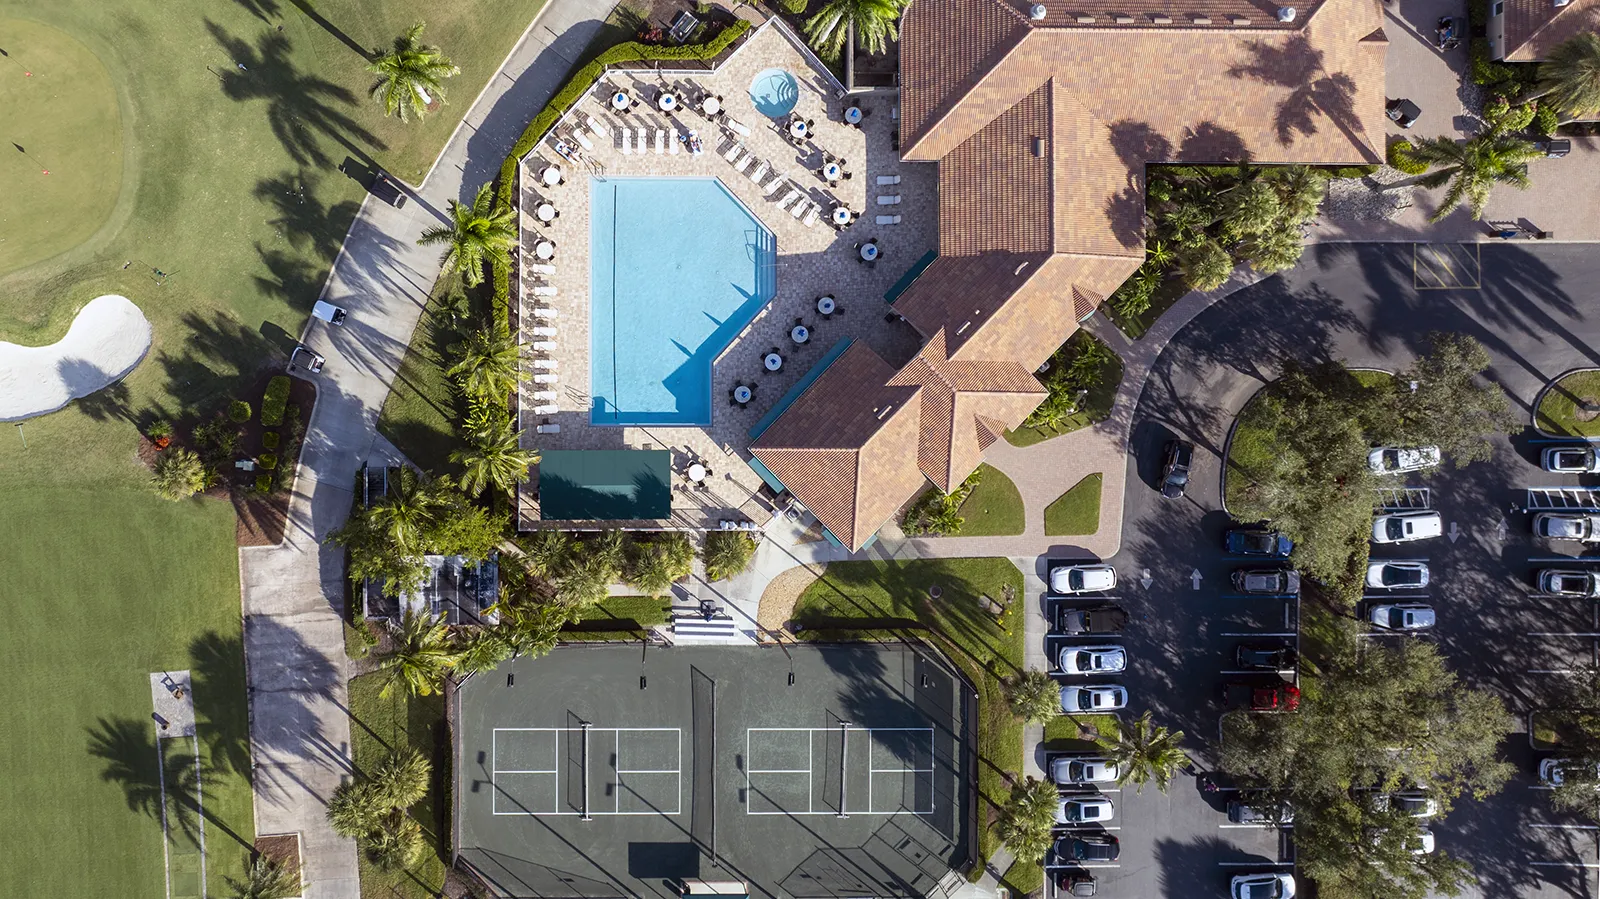
The range inside this community does more work than its median. Closings across the trailing 120 days ran from Sutton Walk at $200,000 to the single-family section at $592,500, against a $272,000 community median. Active listings ask $211 per square foot where sold homes reached $178. Months of inventory moved from 1.6 to 2.7 on 21 active listings and 31 closings. The eight August closings finished at 94.9% of their opening price, $15,950 below it. Comparables should match village and home type.
View 7 more indicators
- Closing Range (Last 120 Days)
- $170,000 to $769,000 across 31 sales
- Active Listings
- 21up 5.0% MoM
- Closings (Last 120 Days)
- 31down 38.0% MoM
- Pending Contracts
- 7down 30.0% MoM
- Re-list Rate
- 14.3%down 5.7 pts MoM
- Sellers Received
- 95.8% of final list pricedown 0.4 pts MoM
- Sellers Received vs Original Ask
- 94.9% of the listing’s opening price (n=8), a median $15,950 below it
WildBlue
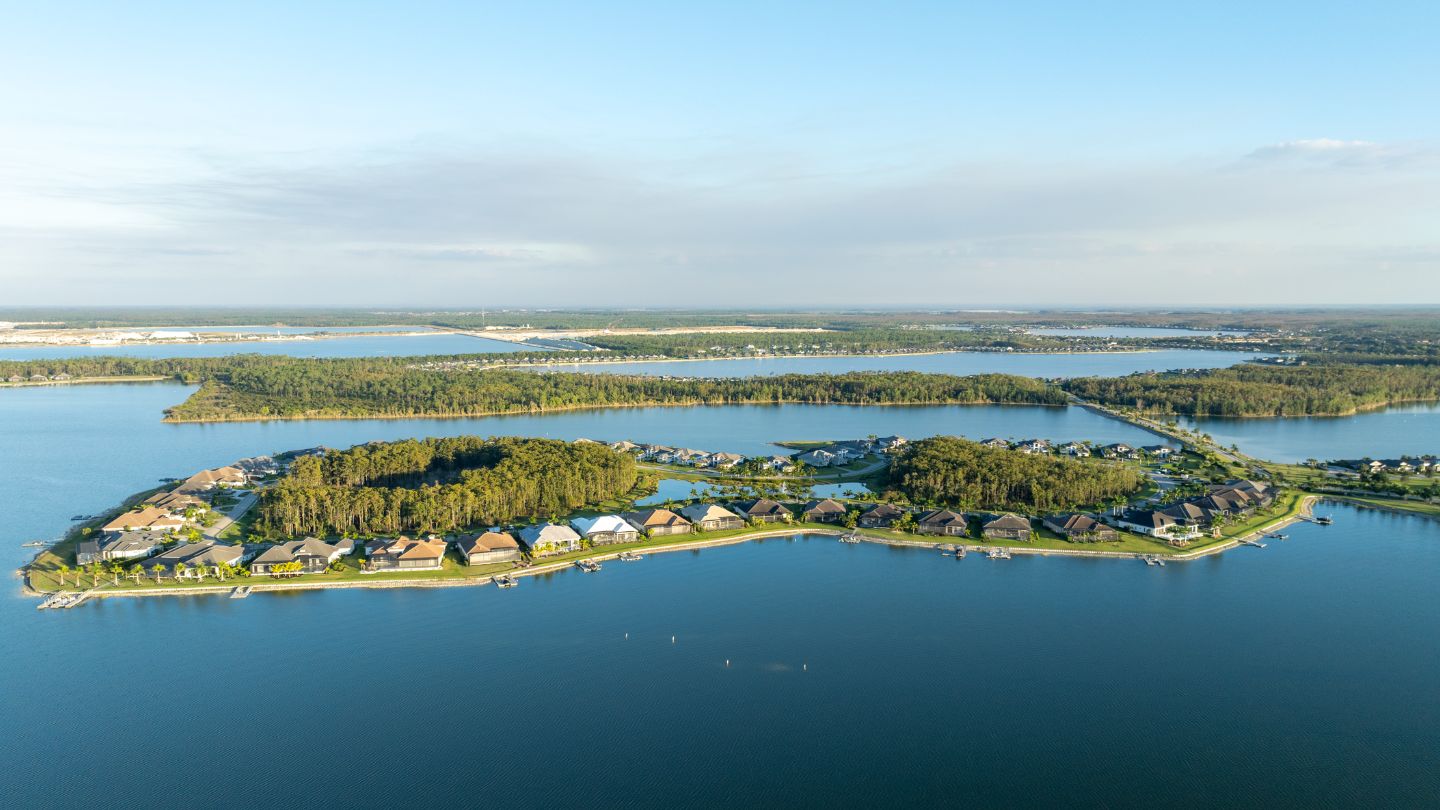
The two sections trade far apart, with Vista WildBlue closing 11 homes at a $1,150,000 median and WildBlue proper seven at $1,760,000. Months of inventory came down from 6.7 to 5.1 across 23 active listings and 18 closings. Five of the six August closings carried an opening price and finished at a median 91.7% of it, $78,000 below, with two of the six classified as relists. The remaining closing was a Sold Data Entry record without MLS listing history, so no opening asking price was available. Comparables here should match section and lake frontage rather than the blended community median.
View 7 more indicators
- Closing Range (Last 120 Days)
- $760,000 to $2,500,000 across 18 sales
- Active Listings
- 23down 23.3% MoM
- Closings (Last 120 Days)
- 18flat MoM
- Pending Contracts
- 5up 66.7% MoM
- Re-list Rate
- 4.3%down 5.7 pts MoM
- Sellers Received
- 94.7% of final list pricedown 1.2 pts MoM
- Sellers Received vs Original Ask
- 91.7% of the listing’s opening price (n=5 of 6 with an opening price), a median $78,000 below it
Monthly market updates
Get the Southwest Florida market in your inbox.
Median price, inventory, and what’s selling across the five cities, once a month.
Frequently Asked Questions
Are Fort Myers home prices rising or falling right now?
Price per square foot has risen in each of the last two months, reaching $201 in August 2026 from a June low of $192, and the median sale price of $345,000 matched August 2025 exactly. Two months is a direction, not a confirmed turn.
How long did Fort Myers homes take to sell in August 2026?
Homes that sold on their first listing attempt had a median 66 days on market across 1,524 closings in the trailing 120 days. Homes that sold after an earlier listing attempt accumulated a median 246 days across their attempts, on 334 closings. The two groups differ in price, property type and condition, so the comparison describes them rather than explaining them.
Is 5.2 months of supply a buyer’s market or a seller’s market in Fort Myers?
Four to six months is generally read as balanced, so 5.2 sits inside that range. Fort Myers supply fell 30.7% from last year, while price per square foot remained 2.9% lower. The two measures moved differently in August. Season matters as well, since peak buying here runs January through April, and August reflects a slower stretch. Conditions vary by price range, so a citywide number describes neither end well.
Final Thoughts
Fort Myers closed August with the median sale price level against last year and price per square foot up for a second month. Buyers signed more contracts than they did a year earlier, and fewer homes were listed for them to choose from. A Fort Myers pricing decision still depends on the price range, the community, condition and closest comparable sales.
Most homeowners feel overwhelmed when it’s time to move. At Worthington Realty, we provide personalized guidance and clear communication so that you feel heard, valued, and confident in your decisions.
– Search Fort Myers homes for sale
– Contact the Worthington Realty team
– Get notified when next month’s report publishes
*Data reflects MLS records as of the date the monthly analysis file was prepared. MLS figures may update as late transactions are recorded.*
*All data referenced in Worthington’s market reports draws from the Florida Gulf Coast MLS (FGCMLS via Stellar MLS) unless otherwise noted.*
What’s Your Fort Myers Home Worth?
Pricing to real, recent comparables is what separates a quick sale from months on market. Start with your address. A Worthington agent follows up with a pricing range, the comparable sales behind it, and the next steps that fit your timing.
Your information stays with Worthington Realty and is never sold or shared.
Get the Southwest Florida Market in Your Inbox
Median price, inventory, and what’s selling across Fort Myers, Cape Coral, Estero, Bonita Springs, and Naples, once a month.
