




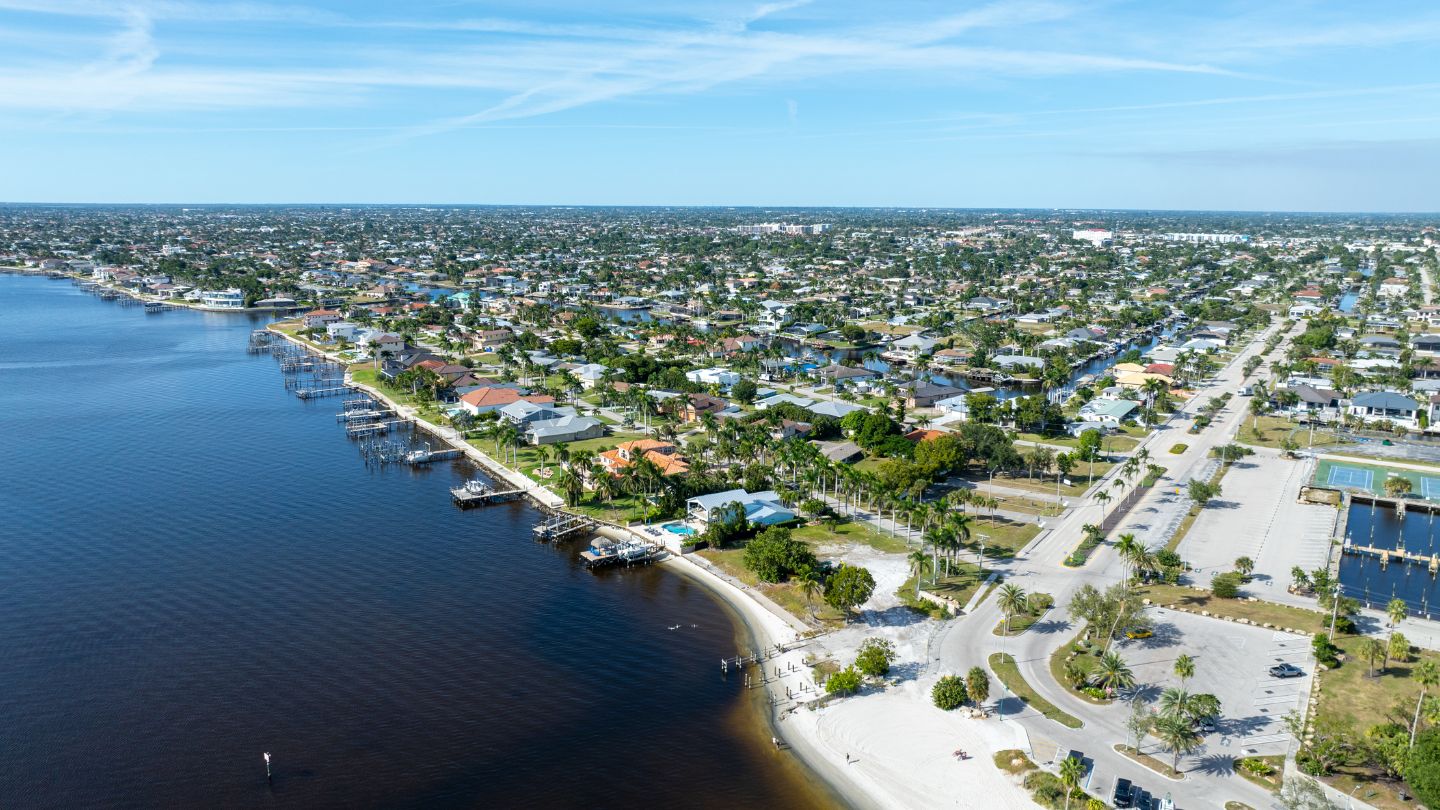
Cape Coral Yacht Club
Median sold · last 120 days$547,500
94.2%Sellers received
44.4%Re-list rate
9Homes for sale
0Under contract


Median price, inventory and what’s actually selling in the Cape Coral housing market, paired with live homes for sale and recent sales from the Worthington Realty research team.
Southwest Florida › Cape Coral
Median Sale Price
$364,950
▲ 2.8% YoYClosed Sales
438
▼ 2.7% YoYActive Listings
2,475
▼ 17.8% YoYMonths of Supply
4.9
▼ 25.8% YoYDays on Market
48
▼ 20.0% YoYRe-list Rate
20.9%
Back on marketIn September 2026 the Cape Coral housing market had 17.8% fewer homes for sale than a year earlier, and the median sale price of $364,950 was 2.8% above last year. Homes that sold went under contract in a median 48 days, down from 60. Single-family homes, about nine in ten Cape Coral sales, sold for a median $380,000, up 4.1%.
Figures for all home types in Cape Coral from the Florida Gulf Coast MLS (FGCMLS via Stellar MLS), data as of October 10, 2026. Market analysis by Michael Davis, Worthington Realty. How we get our numbers
The newest active listings in Cape Coral, pulled live from the MLS. Use the button below the homes to see every Cape Coral home for sale, then filter by price, community, or beds. A free account saves your searches and sends new-listing alerts. New to the area? Our Southwest Florida home buying guide walks you through each step. Looking for a particular community? Browse homes by community.
Pick a measure to see how Cape Coral has moved month by month since January 2021.
Monthly, five years
New Pending Sales counts contracts that went pending during each month. Homes under contract (636 as of October 1, 2026) is a separate point-in-time total.
Each view uses its own scale, so compare the figures, not the height of the lines. Single-family and condo figures use the InfoSparks property types. Townhouses, manufactured homes and other home types count only in All homes, so the two groups do not add up to the total.
| Month | Median Price | New Listings | Homes for Sale | New Pending Sales | Closed Sales | Days on Market | Months Supply |
|---|---|---|---|---|---|---|---|
| Sep 2025 | $355,000 | 688 | 3,010 | 450 | 450 | 60 | 6.6 |
| Oct 2025 | $363,000 | 805 | 3,078 | 415 | 465 | 62 | 6.6 |
| Nov 2025 | $373,250 | 706 | 3,116 | 397 | 390 | 66 | 6.6 |
| Dec 2025 | $364,400 | 659 | 3,037 | 356 | 462 | 55 | 6.4 |
| Jan 2026 | $350,000 | 1,047 | 3,253 | 553 | 347 | 48 | 6.7 |
| Feb 2026 | $375,000 | 834 | 3,256 | 558 | 467 | 51 | 6.7 |
| Mar 2026 | $351,750 | 842 | 3,107 | 673 | 598 | 53 | 6.4 |
| Apr 2026 | $365,500 | 848 | 3,052 | 566 | 629 | 49 | 6.2 |
| May 2026 | $369,945 | 711 | 2,890 | 555 | 548 | 44 | 5.9 |
| Jun 2026 | $375,000 | 678 | 2,719 | 522 | 582 | 47 | 5.5 |
| Jul 2026 | $389,950 | 701 | 2,627 | 503 | 548 | 54 | 5.2 |
| Aug 2026 | $380,000 | 721 | 2,520 | 477 | 489 | 54 | 5.0 |
| Sep 2026 | $364,950 | 671 | 2,475 | 465 | 438 | 48 | 4.9 |
Take this month’s snapshot with you
When friends and family ask how Cape Coral is doing, hand them the answer. One page, the stats that matter, and what this month means, ready to print or send.
Open a topic for the numbers, what they mean and recent history. Time to sell, the re-list rate and asking price come first because sellers ask about them most.
Homes that sold in September 2026 spent a median 48 days on market, against 60 days for homes that sold in September 2025. Days on market has been below last year for nine months in a row. It runs from the date a listing goes live to the date a contract is accepted. These figures describe homes that sold, so they do not predict how long every home for sale today will take. Single-family homes that sold in September took a median 46 days, down from 60 a year earlier. Condos took 73 days, on 32 sales.
Over the 120 days through October 1, homes that sold on their first listing took a median 49 days to go under contract. Homes that sold only after being relisted spent a median 222 days listed in total. The typical relisted home sold for $34,950 less than its first asking price.
The two groups differ in price, condition and seller circumstances, so the data does not show that relisting caused the longer sale or the lower price. How many homes for sale have been listed before is under Re-list rate.
A financed sale often takes about four to six weeks to close after a contract is accepted. A cash sale can close faster. Inspections, insurance, association approvals and the appraisal can all move the date.
| Closing month | Days | Bar |
|---|---|---|
| September 2025 | 60 | |
| October 2025 | 62 | |
| November 2025 | 66 | |
| December 2025 | 55 | |
| January 2026 | 48 | |
| February 2026 | 51 | |
| March 2026 | 53 | |
| April 2026 | 49 | |
| May 2026 | 44 | |
| June 2026 | 47 | |
| July 2026 | 54 | |
| August 2026 | 54 | |
| September 2026 | 48 |
The monthly series covers homes that closed in each month. The 49-day and 222-day figures come from Worthington’s address-matched MLS records for the 120 days through October 1, 2026.
Definitions and methodology: Days on market explained. Selling timeline guide.
The Re-list Rate is the share of homes for sale with an expired, withdrawn or terminated listing at the same address in the past 12 months. A sale in between starts a new owner’s history, so it does not count. As of October 1, 2026, 509 of 2,440 Cape Coral homes for sale, or 20.9%, had been listed before. Of those, 53.0% came back at least 3% below their earlier asking price.
Over the 120 days through October 1, homes that sold on their first listing took a median 49 days to go under contract. Homes that sold only after being relisted spent a median 222 days listed in total, and the typical one sold for $34,950 less than its first asking price. The two groups differ in price, condition and seller circumstances, so the data does not show that relisting caused the longer sale or the lower price.
Definitions and methodology: Why homes get relisted.
Sellers received a median 97.4% of their final asking price in September 2026, up from 97.3% a year earlier. The ratio uses the asking price in place when the contract was signed, so earlier price cuts are not counted. It describes the market as a whole and is not a target for your offer.
Single-family sellers received a median 97.7%, up from 97.3% a year earlier. Condo sellers received 92.7%, on 32 sales.
Cape Coral sold-to-list ratio, share of final asking price
| Month | Share of final asking price |
|---|---|
| Sep 2025 | 97.3% |
| Oct 2025 | 97.1% |
| Nov 2025 | 97.3% |
| Dec 2025 | 97.1% |
| Jan 2026 | 96.3% |
| Feb 2026 | 96.9% |
| Mar 2026 | 97.4% |
| Apr 2026 | 97.3% |
| May 2026 | 97.7% |
| Jun 2026 | 97.8% |
| Jul 2026 | 97.9% |
| Aug 2026 | 97.8% |
| Sep 2026 | 97.4% |
The Ask-Bid Gap compares what sellers are asking per square foot with what buyers paid per square foot over the last 120 days. A gap of 10% means sellers are asking 10% more per square foot than buyers have paid. The citywide gap was 5.9%.
| Price range | Ask-Bid Gap |
|---|---|
| Under $400,000 | 5.8% |
| $400,000 to $750,000 | −2.2% |
| $750,000 to $1.5 million | 5.4% |
| Above $1.5 million | 8.7% |
A reading below zero means listings in that range are asking less per square foot than buyers paid over the last 120 days. The $400,000 to $750,000 range has read below zero for three months in a row. In any range, check comparable closings before using nearby asking prices as your pricing guide.
Definitions and methodology: Sale-to-list ratio explained.
The median sale price in the Cape Coral housing market was $364,950 in September, up 2.8% from $355,000 a year earlier. It has been above last year for five months in a row, May through September.
Price per square foot went the other way. It was $212, 1.4% below last year, after $222 in July and $220 in August. The 3.6% drop from August was the largest August-to-September move in five years. When more large homes close in a month, the median can rise while price per square foot falls.
Single-family homes sold for a median $380,000, up 4.1% from $365,000 a year earlier, and $215 per square foot, down 1.8%. Condos are a small part of the Cape Coral market, 32 of 438 September sales, so their monthly median moves a lot. In September it was $225,000.
| Measure | All homes | Single-family | Condos |
|---|---|---|---|
| Median price | $364,950+2.8% | $380,000+4.1% | $225,000+25.0% |
| Price per sq. ft. | $212−1.4% | $215−1.8% | $177+16.4% |
| Closed | 438−2.7% | 399−2.2% | 32−8.6% |
| Pending | 465+3.3% | 424+1.4% | 36+33.3% |
| For sale | 2,475−17.8% | 2,194−16.7% | 252−25.4% |
| Months of supply | 4.9−25.8% | 4.8−25.0% | 5.8−42.0% |
| Days on market | 48−20.0% | 46−23.3% | 73−7.6% |
| Sold-to-list | 97.4%+0.1 pts | 97.7%+0.4 pts | 92.7%−1.3 pts |
Source: FGCMLS via Stellar MLS, InfoSparks property types. Townhouses, manufactured homes and other home types count only in All homes.
Cape Coral median sale price, change from the same month a year earlier
| Month | Change from a year earlier |
|---|---|
| Sep 2025 | −5.3% |
| Oct 2025 | −6.9% |
| Nov 2025 | −3.6% |
| Dec 2025 | −3.4% |
| Jan 2026 | −4.1% |
| Feb 2026 | −3.2% |
| Mar 2026 | −4.8% |
| Apr 2026 | −0.9% |
| May 2026 | +2.8% |
| Jun 2026 | +3.0% |
| Jul 2026 | +11.4% |
| Aug 2026 | +6.1% |
| Sep 2026 | +2.8% |
Cape Coral price per square foot, change from the same month a year earlier
| Month | Change from a year earlier |
|---|---|
| Sep 2025 | −6.1% |
| Oct 2025 | −5.3% |
| Nov 2025 | −4.4% |
| Dec 2025 | −0.9% |
| Jan 2026 | −5.9% |
| Feb 2026 | −3.1% |
| Mar 2026 | −5.0% |
| Apr 2026 | −1.4% |
| May 2026 | −0.5% |
| Jun 2026 | +1.4% |
| Jul 2026 | +3.7% |
| Aug 2026 | +2.3% |
| Sep 2026 | −1.4% |
The five-year chart above shows the full monthly history.
Definitions and methodology: Median sale price vs. price per square foot.
Active listings in the Cape Coral housing market came in at 2,475, down 17.8% from a year earlier and lower in each of the last seven months. Sellers added 671 new listings in September, 2.5% fewer than a year earlier. Months of supply was 4.9, down from 6.6 a year earlier. Published months of supply counts every listing against the average monthly pending sales of the last 12 months.
There were 2,194 single-family homes for sale, with 4.8 months of supply, down from 6.4 a year earlier. There were 252 condos for sale, with 5.8 months of supply, down from 10.0.
Cape Coral homes for sale at month end, single-family homes vs. condos
| Month | Single-family | Condos |
|---|---|---|
| Sep 2025 | 2,633 | 338 |
| Oct 2025 | 2,686 | 352 |
| Nov 2025 | 2,713 | 366 |
| Dec 2025 | 2,652 | 348 |
| Jan 2026 | 2,814 | 396 |
| Feb 2026 | 2,820 | 391 |
| Mar 2026 | 2,701 | 362 |
| Apr 2026 | 2,666 | 345 |
| May 2026 | 2,529 | 319 |
| Jun 2026 | 2,383 | 298 |
| Jul 2026 | 2,312 | 280 |
| Aug 2026 | 2,244 | 245 |
| Sep 2026 | 2,194 | 252 |
Worthington’s Competitive Inventory looks past the total count. Of the listings in our October 1 count, 501 had been on the market 180 days or more. About 220 more came back after an earlier listing at nearly the same price, less than 3% lower. Buyers can still choose any of them. The screen leaves them out because of how long they have been listed or how little their price came down.
Definitions and methodology: Months of supply explained, Competitive Inventory methodology.
Pending sales came in at 465, up 3.3% from 450 a year earlier. They have been above last year in 10 of the last 12 months.
By home type, single-family contracts rose 1.4% from a year earlier, to 424. Buyers signed 36 condo contracts, against 27.
Cape Coral pending sales, contracts signed each month
| Month | This year | A year earlier |
|---|---|---|
| Sep 2025 | 450 | 394 |
| Oct 2025 | 415 | 278 |
| Nov 2025 | 397 | 352 |
| Dec 2025 | 356 | 307 |
| Jan 2026 | 553 | 426 |
| Feb 2026 | 558 | 573 |
| Mar 2026 | 673 | 611 |
| Apr 2026 | 566 | 540 |
| May 2026 | 555 | 517 |
| Jun 2026 | 522 | 466 |
| Jul 2026 | 503 | 437 |
| Aug 2026 | 477 | 491 |
| Sep 2026 | 465 | 450 |
Cape Coral listings averaged 4.4 showings in September, up from 3.5 a year earlier and the most for any September since 2022. Showings per listing have been above last year for 14 months in a row. Part of the rise may come from having fewer homes for sale, which spreads buyer visits across fewer listings. Homes that went under contract had a median 7.5 showings beforehand, against 8 a year earlier.
The 636 homes under contract on October 1 is a point-in-time count of every pending home, not the number of contracts signed in September. Measured against the 2,440 listings in our October 1 count, that is a pending-to-active ratio of 26.1%, or about 26 homes under contract for every 100 for sale.
Showing figures come from ShowingTime data in InfoSparks (FGCMLS via Stellar MLS) and cover listings that use the showing service.
Definitions and methodology: Pending sales explained.
Both the median and the mortgage rate rose over the year. At the October 8 rate of 7.40%, the payment would be $2,021.
Cape Coral recorded a $364,950 median across 438 September closings. Each row compares a city with its own figures from September 2025.
All year-over-year columns compare against September 2025. Tap any city to open its market page.
| City | Median Price | Median YoY | Price/SF | Active | Active YoY | Mo. Supply | Sold-to-List | Closed |
|---|---|---|---|---|---|---|---|---|
| Fort Myers | $341,000 | -1.0% | $198 | 2,487 | -17.7% | 5.3 | 96.0% | 380 |
| Cape Coral | $364,950 | +2.8% | $212 | 2,475 | -17.8% | 4.9 | 97.4% | 438 |
| Estero | $465,000 | -14.7% | $252 | 463 | -29.1% | 3.6 | 96.7% | 99 |
| Bonita Springs | $535,250 | -3.6% | $297 | 731 | -23.1% | 4.7 | 95.2% | 107 |
| Naples | $589,450 | +3.4% | $329 | 4,000 | -18.6% | 5.4 | 95.6% | 602 |
| SW Florida | $390,500 | -0.9% | $232 | 15,178 | -17.5% | 5.5 | 96.5% | 2,293 |
Source: FGCMLS via Stellar MLS, data as of October 10, 2026. Prices are single-month medians. SW Florida covers the full FGCMLS footprint, not an average of the five cities.
These are the readings we will check when October data comes in. They are not forecasts.
The most recent closings in Cape Coral, the clearest read on what buyers are actually paying. Use the button below the homes to look up sold prices in your own community, the best pricing guide when you are preparing to sell. Ready for a number on your own home? See what your home is worth.
Waterfront category drives value here. Share your address and a Worthington agent sends a pricing range, the recent comparable sales behind it, and the next steps that fit your timing. No obligation. Getting ready to list? See how we sell homes in Southwest Florida.
Median sold price uses closings from the trailing 120 days; inventory and re-list figures are snapshots as of October 1, 2026. Each community is a starting point; tap in to see current listings.
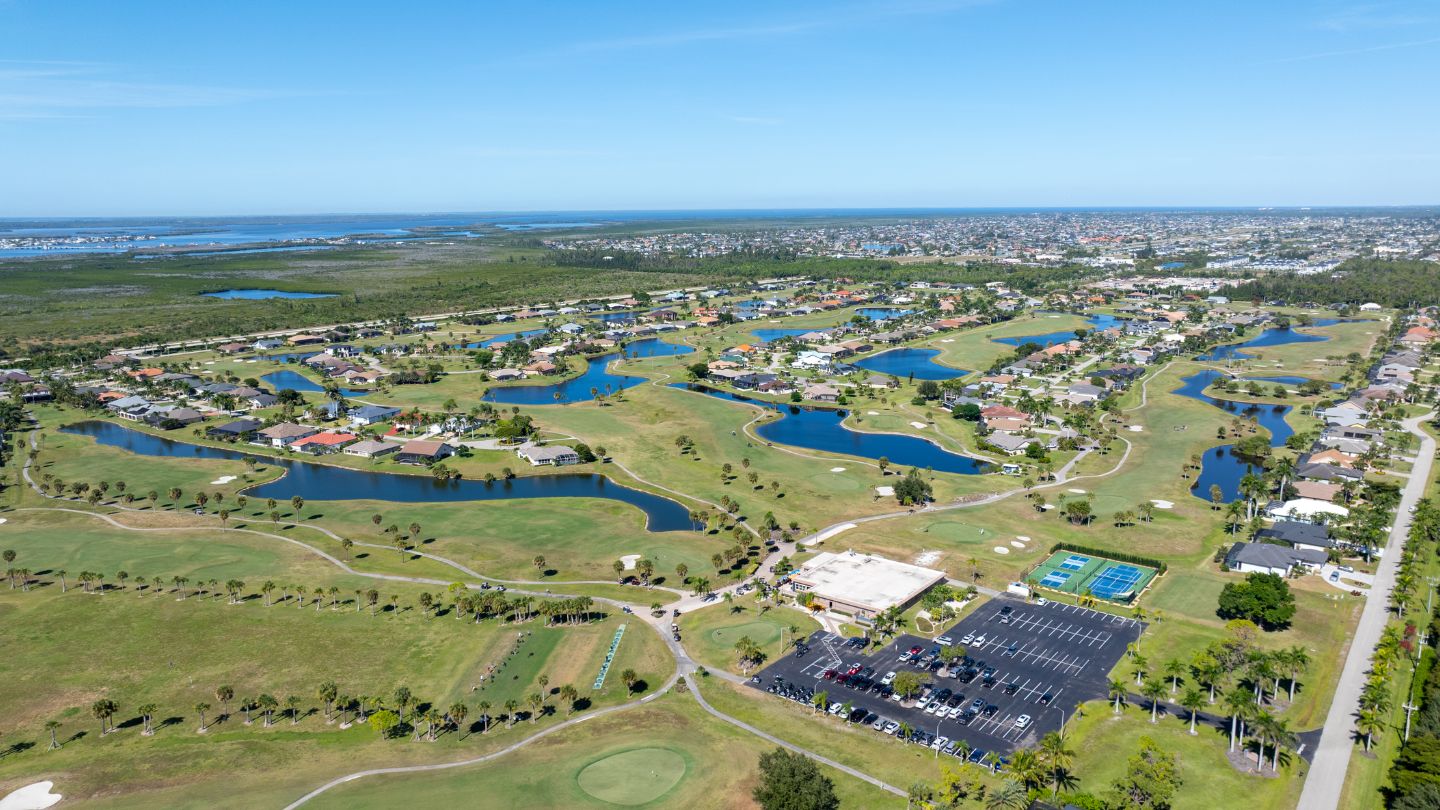
Median sold · last 120 days$547,500
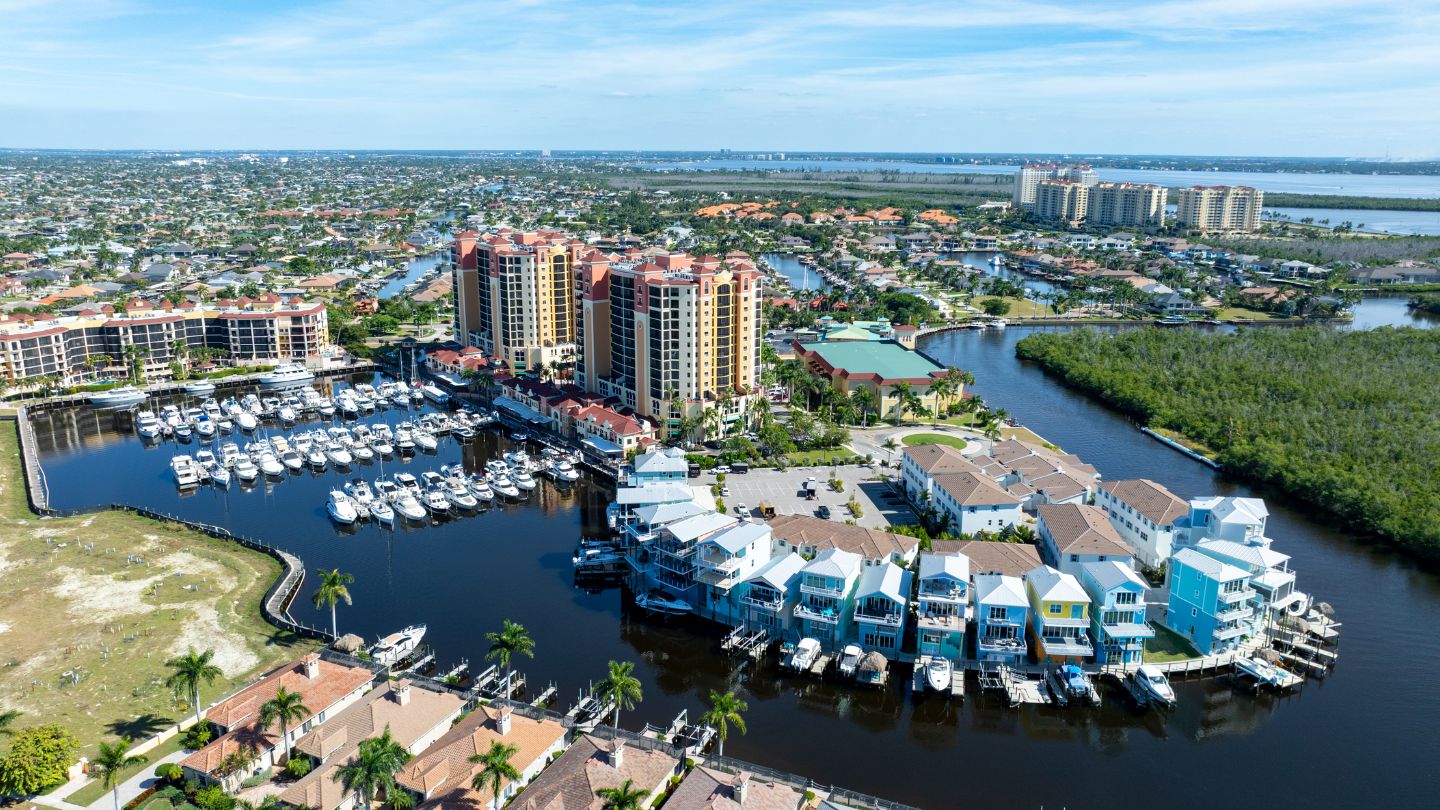
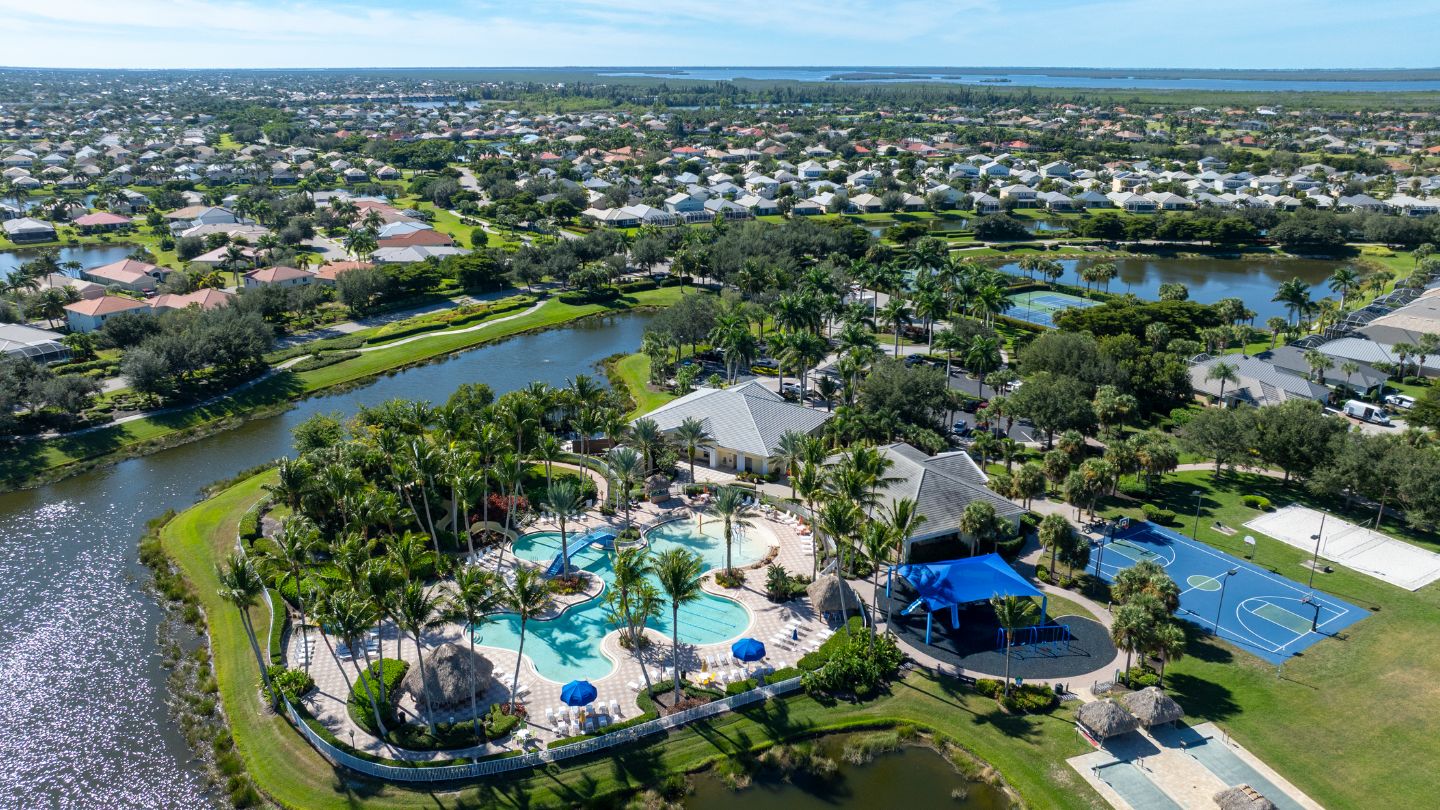
Median sold · last 120 days$456,250
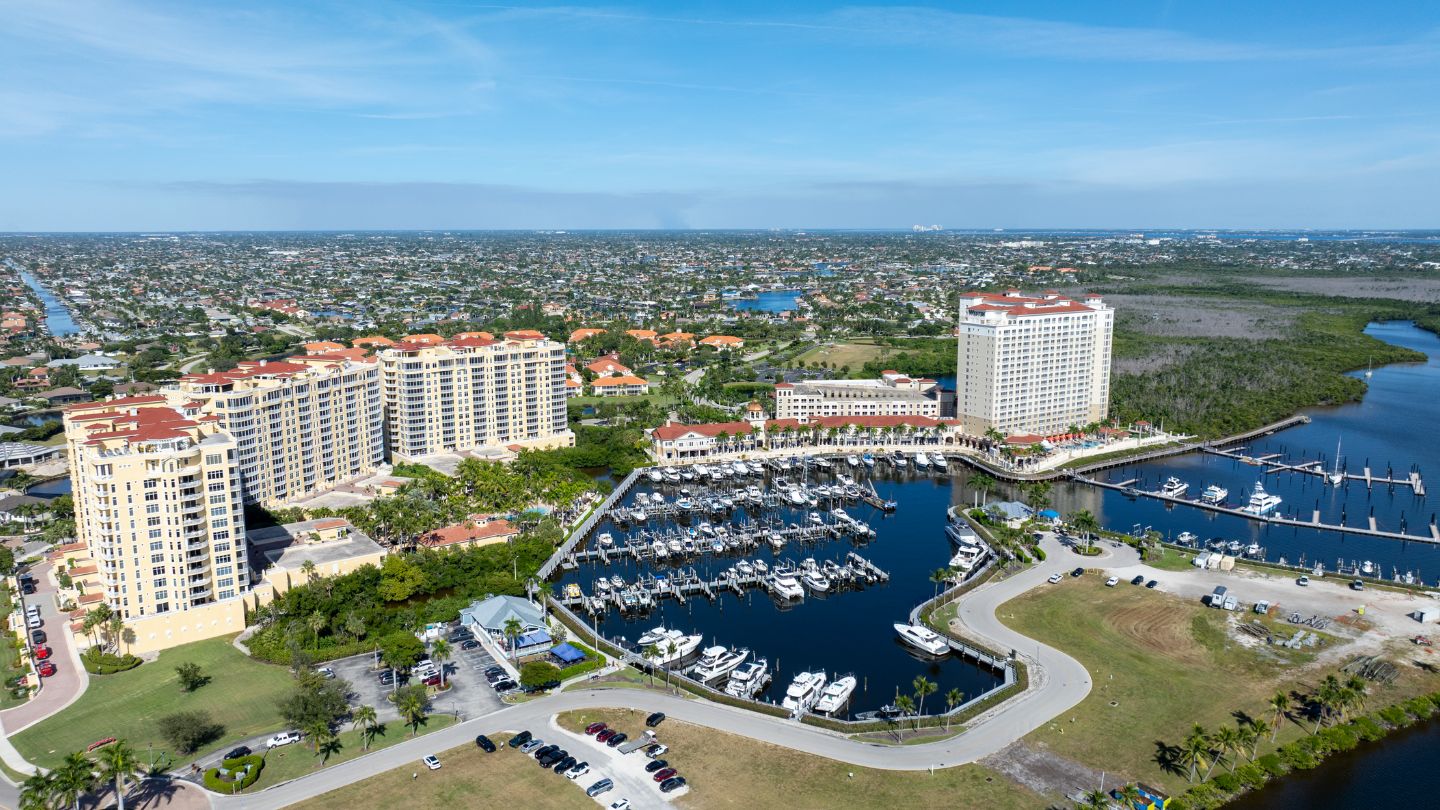
Median sold · last 120 days$685,000
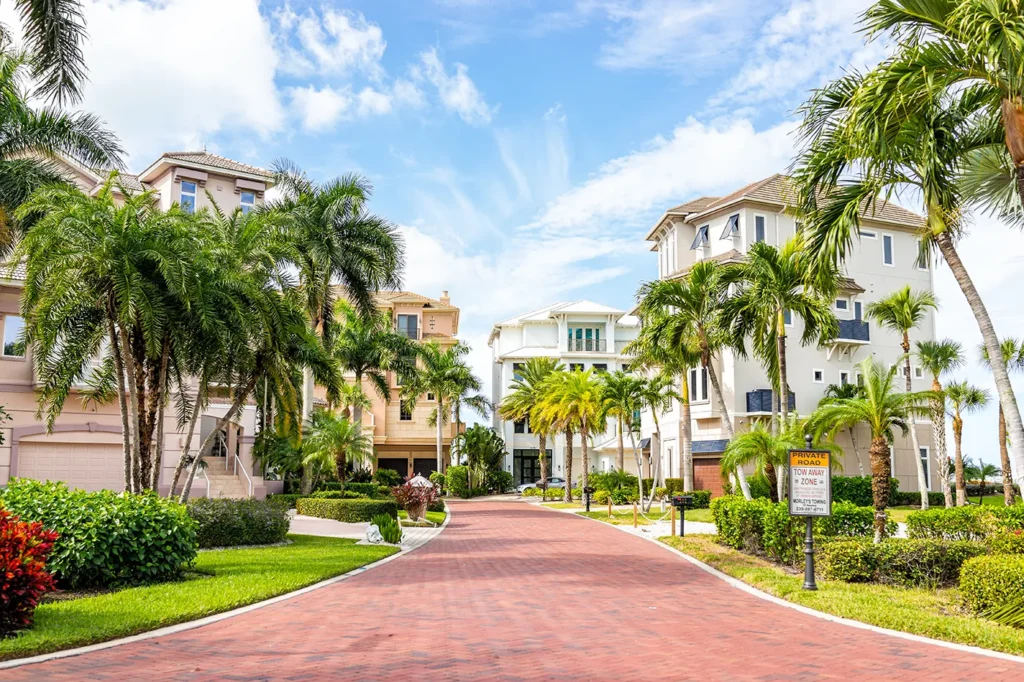
Median sold · last 120 days$382,500
Median sold · last 120 days$700,000
Community medians combine all product types and price tiers and are a starting point only; price to sub-neighborhood and floor-plan comparables. Source: FGCMLS via Stellar MLS.
A quick orientation for anyone weighing a move to the area.
Cape Coral is built for the water, with a canal grid running through most of the city and many homes holding direct Gulf access. Boating shapes daily life in the waterfront neighborhoods. Over the past year, most Cape Coral homes sold for between $250,000 and $550,000, and Gulf-access and riverfront homes often sell for well above that.
A growing dining and entertainment core near the Yacht Club and Cape Harbour anchors the south end, and the city sits across the river from Fort Myers with quick routes to Sanibel and Fort Myers Beach. Buyers should weigh canal type (Gulf-access, freshwater, or inland), bridge clearance, and flood-zone insurance costs, which vary block to block.
Pick your current city and see the Southwest Florida winter waiting for you.
Climate comparisons use NOAA 1991–2020 climate normals and Comparative Climatic Data.
Check a Cape Coral address’s flood zone
Flood zone and insurance costs can vary from one block to the next in Cape Coral. Look up the FEMA flood zone for any address in seconds, so you know the zone before you get an insurance quote and make an offer.
Open the flood zone lookup →Cape Coral had 4.9 months of supply in September 2026, inside the 4 to 6 month range usually read as balanced, and down from 6.6 a year earlier. There were 2,475 homes for sale, 17.8% fewer than last September. Leaving out listings on the market 180 days or more and relists that came back less than 3% lower, there was about 3.4 months of supply. Sellers received a median 97.4% of their final asking price. Sellers were asking 5.9% more per square foot than buyers have paid, so pricing near recent sales in your neighborhood is likely to matter more than the month you list. Buyer activity in Southwest Florida usually runs highest from January through April.
Cape Coral had 2,475 active listings in September 2026 and 4.9 months of supply, down from 6.6 a year earlier. The median sale price was $364,950, up 2.8%, and price per square foot was $212. About one in five active listings had an earlier listing that did not sell. Check a home’s listing history before you treat it as new. Whether the market suits you depends on your price range, the neighborhood and how long you plan to stay.
Homes that sold on their first attempt took a median of 49 days. Homes that sold after relisting took a median of 222 days across their attempts. The typical relisted home sold for $34,950 less than its first asking price. The two groups differ in price, condition and seller circumstances, so the numbers do not explain any one house. If your home has been on the market a while, compare your asking price with recent closings in your own neighborhood.
Sellers received a median 97.4% of their final asking price in September 2026, up from 97.3% a year earlier. That describes the market as a whole and is not a target for your offer. The citywide Ask-Bid Gap was 5.9%. From $400,000 to $750,000 it read -2.2%. Active listings in that range asked less per square foot than recent buyers paid. What a specific home is worth depends on its condition, its location and its own listing history.
Homes that closed in September 2026 took a median 48 days to go under contract, down from 60 a year earlier. Over the 120 days through October 1, first-attempt sales took a median of 49 days. Homes that sold after an earlier attempt took a median of 222 days. A relisted home’s days-on-market count starts over at zero. The number on a listing can understate its full time on the market.
In September 2026, single-family homes had 4.8 months of supply and condos had 5.8. Single-family homes that sold took a median 46 days to go under contract, and condos took 73. The single-family median was $380,000, up 4.1% from a year earlier. Condos are a small part of the Cape Coral market, 32 of 438 September sales, so their monthly figures move a lot. Condos here means condominiums. Townhouses and other home types count only in the all-homes figures.
Three carry the most weight right now. Showings per listing at 4.4 are up 25.7% and have been above last year for 14 months. Months of supply of 4.9 counts every active listing, and Competitive Inventory of 3.4 months leaves out listings on the market 180 days or more and relists that came back less than 3% lower. The Re-list Rate of 20.9% covers 509 of 2,440 active listings, which is why a listing’s history is worth checking.
Flood zones in Cape Coral change from one block to the next, and they affect both insurance cost and lender requirements. Look up the FEMA flood zone for any Cape Coral address with Worthington’s Southwest Florida flood zone lookup, then confirm a current insurance quote before you make an offer.
Each city has its own homes for sale, recent sales and monthly market update.
Still comparing areas? The Southwest Florida page puts all five cities side by side.
Explore Southwest FloridaTalk through the Cape Coral market with a local expert
Whether you’re buying or selling, Worthington Realty prices to real comparables and keeps you a step ahead.
Request a Cape Coral Pricing Analysis
Waterfront category drives value here. Start with your address. A Worthington agent follows up with a pricing range, the comparable sales behind it, and the next steps that fit your timing.
Your information stays with Worthington Realty and is never sold or shared.
Get monthly market updates
Free · Two quick steps · Unsubscribe anytime
Worthington Realty
Talk to an Agent
Buying, selling, renting or just starting to think about it. Tell us what’s on your mind and the right person on our team will reach out.
Prefer to call? (239) 437-3334, Monday to Friday, 9 a.m. to 5 p.m.
 Fort Myers
 Estero
 Bonita Springs
 Naples