


This is a past report. It covers Southwest Florida market data for August 2026. For current numbers, see our Southwest Florida housing market page.
Southwest Florida Closed Sales Fell 3.1% in August While Pending Contracts Rose 7.2% and Active Inventory Dropped for a Sixth Straight Month
Price / Sq Ft
$234
Median Sold Price
$399,000
Active Listings
14,852
Months of Supply
5.4
Southwest Florida closed sales came in below August 2025, but buyers put more homes under contract, and the number available to buy fell to its lowest point since February.
Each of the five city reports is linked at the bottom and covers the same reporting cycle using the same MLS source framework.
*Unless otherwise noted, housing-market figures come from the Florida Gulf Coast MLS (FGCMLS via Stellar MLS), pulled September 1, 2026. Data reflects MLS records as of the date the monthly analysis file was prepared. MLS figures may update as late transactions are recorded.*
Key Takeaways
- Fewer homes finished closing in August than a year earlier. Closed sales came in at 2,285, down 3.1% from August 2025.
- Buyers stayed active during the month itself. Pending contracts rose 7.2% to 2,519, and showings per listing reached 3.2 against 2.9 a year earlier.
- The pool of homes for sale kept shrinking. Active listings fell to 14,852, down 20.7% year over year and lower in each month since February. That count also falls through withdrawals and expirations, so the decline reflects more than completed sales.
- At the recent pace of sales it would take 5.4 months to sell through everything currently listed, down from 7.8 months a year earlier. That figure is regional months of supply.
- Homes sold faster than a year earlier. The regional median was 63 days on market against 72 in August 2025.
Southwest Florida Closed Sales Came In Below Last Year While Pending Contracts Rose
Southwest Florida recorded 2,285 closed sales in August 2026 against 2,358 in August 2025, a decline of 3.1%. Dollar volume rose 3.6%, though, reaching $1.44 billion.
Pending contracts rose 7.2% to 2,519 over the same month. Showings per listing reached 3.2 against 2.9 a year earlier.
Closed sales describe transactions that began weeks earlier. Pending contracts describe activity during the month itself. August also falls inside Southwest Florida’s slower season, which runs May through September. Both counts sit in a period of reduced activity.
The Pending-to-Active Ratio compares homes currently under contract to homes currently available. This is a snapshot of the market at the pull date. It measures activity levels rather than what buyers are paying, and it is not a conversion rate.
For a homeowner deciding whether to list this fall, the pending count gives the more current view. It describes buyers who were shopping in August, while the closing count describes contracts generally signed weeks earlier.
Mortgage Rates Are Higher Than a Year Ago
The 30-year fixed-rate mortgage averaged 6.66% in the week of August 27, 2026, according to the Freddie Mac Primary Mortgage Market Survey. That compares to 6.65% the prior week and 6.56% in the same week of 2025.
This is the first month in this reporting series where the rate sits above its level a year earlier. For illustration, a loan covering 80% of the regional median sale price of $399,000 at that survey rate carries principal and interest of roughly $2,050 a month. That figure excludes property taxes, homeowners insurance and association fees, and the survey average is not a rate quote available to any particular buyer.
At 6.66%, the late-August survey average offered little year-over-year relief to financed buyers. Cash purchases are not tied to a mortgage payment.
Active Listings Fell for a Sixth Straight Month
Southwest Florida active listings totaled 14,852 in August 2026, down 20.7% from 18,719 in August 2025. The count has declined in each month since February, when it stood at 21,894.
New listings came in at 3,348, down 5.7% year over year.
The active count includes newly listed homes, homes relisted after an earlier attempt, and homes listed for a year without a price change. It also falls for several reasons at once, including completed sales, expirations and withdrawals. A declining count shows the pool of available homes shrinking. It does not by itself establish how much of that came from buyers.
New listing volume is best compared to the same month a year earlier rather than to July. Seasonal patterns move the raw count on their own.
For a seller, a smaller active pool means fewer MLS listings across Southwest Florida than last August. For a buyer, it means less to choose from.
Months of Supply Was 5.4, and the Competitive Inventory View Runs Lower
Regional months of supply stood at 5.4 in August 2026, down from 7.8 a year earlier. Table 1 carries each city.
Months of supply divides current active listings by a sales pace. It answers one question: at the recent rate of sales, how long would it take to sell through what is listed today.
Season matters when reading it here. Southwest Florida’s peak buying period runs January through April, the reverse of most of the country. The same figure in February would describe a market with more buyers in it. The year-over-year comparison carries more meaning here than the month-to-month move.
Competitive Inventory is a supplemental view that removes two groups from the active count. The first is listings active at least 180 days without a price reduction of 3% or more. The second is relisted homes that returned with a price change under 3%. What remains is the fresher and more substantially repriced part of the active pool.
Competitive Inventory compares the filtered active count with the city’s total three-month closing pace. Because the active and sold groups are not filtered the same way, it is a screening indicator rather than an estimate of how long those particular listings would take to sell. A homeowner comparing their own home to what is listed nearby is looking at the full active count. Competitive Inventory answers a narrower question: which of those listings are recent or more substantially repriced.
Roughly One in Five Active Listings Had an Earlier Listing Attempt
Roughly one in five active Southwest Florida listings carried an earlier expired, withdrawn or terminated listing at the same address within the past 12 months. That share is the Re-list Rate.
Roughly half of those returning listings came back at the same price or with a reduction under 3%.
This matters to buyers because of the DOM Reset. When a home returns to the MLS under a new listing, its days-on-market counter starts over at zero. The days-on-market number shown on an active listing may not reflect its cumulative marketing time across listing attempts.
Homes that sold on their first listing attempt reached a contract faster than homes that had been listed before. City-level readings for both groups are in Table 2.
Those two groups differ in price, property type, condition and seller circumstances. The figures describe how the groups performed. They do not establish that relisting or the opening price caused the difference.
For a seller setting expectations, the first-attempt figure is a cleaner timing reference for homes that sold without returning to market. For a buyer, a listing’s days-on-market number is worth checking against the property’s full history before treating the home as newly listed.
For Southwest Florida sellers
Curious what your Southwest Florida home would bring in today’s market?
Get a Worthington pricing analysis built from the same MLS data behind this report.
August Closings Show Why Opening Price Matters
The community profiles now compare each eligible August closing with the opening asking price of the listing that sold. This differs from the standard sale-to-list ratio, which uses the final asking price in place when the home went under contract. Neither one reveals every negotiation, concession or offer that was declined along the way.
Each city report carries the results for its own featured communities, with the sample size shown for each one. Small samples describe those particular sales and should not be treated as a community-wide pricing benchmark.
Sellers Received 96.5% of Their Most Recent Asking Price
The regional sale-to-list ratio was 96.5% in August 2026, up from 96.0% a year earlier.
This ratio uses the most recent list price at the time of contract rather than the original asking price. It describes where closings landed across the market as a whole. It is not a guide to what any individual buyer should offer or what any individual seller will receive.
For a buyer writing an offer, the regional figure is market context rather than a target. What a particular home sells for depends on its price range, its condition and its own listing history.
The Ask-Bid Gap Compares Asking Prices With What Recent Buyers Paid
Ask-Bid Gap compares two medians: the asking price per square foot of active listings, and the price per square foot of recent closings in the same price range. Worthington calculates it for each city rather than for the region, because the mix of homes on the market differs from one city to the next.
Citywide readings are in Table 2, and each city report breaks its own market out by price range. Readings above $1.5 million rest on thin closing samples, where variation in finish and location separates asking prices from recent results.
The active homes and the sold homes are not the same properties, and they can differ in condition, location, age and finish. This measure shows how closely the two groups line up. It does not set an offer percentage, and it does not predict any single home’s sale price or marketing time.
A wide reading in one price range means asking prices there sit further from recent closings than in other ranges. For anyone buying or selling in that range, the closed sales most like the home in question remain the comparison that matters.
Table 1: Core Market Metrics, August 2026
Use these tables for reference, then read each city against its own recent history.
| City | Median Sold Price | Median Price per Sq. Ft. | Active Listings | Months of Supply | Sold-to-List | Closed Sales YoY |
|---|---|---|---|---|---|---|
| Fort Myers | $345,000 (0.0%) | $201 (-2.9%) | 2,447 (-20.0%) | 5.2 (-30.7%) | 95.7% | -5.5% |
| Cape Coral | $382,375 (+6.8%) | $222 (+3.3%) | 2,441 (-22.4%) | 4.8 (-31.4%) | 97.7% | -5.0% |
| Estero | $517,500 (+6.2%) | $250 (0.0%) | 441 (-32.5%) | 3.5 (-44.4%) | 95.9% | -2.2% |
| Bonita Springs | $505,000 (+0.5%) | $287 (-2.0%) | 668 (-30.2%) | 4.3 (-41.1%) | 95.1% | -14.8% |
| Naples | $610,000 (+1.7%) | $328 (+1.5%) | 3,858 (-23.2%) | 5.2 (-35.0%) | 95.5% | -5.8% |
Source: FGCMLS. Single-month data unless otherwise noted. Sold-to-list uses most recent list price at time of contract.
Table 2: Worthington Market Lens, August 2026
| City | Competitive Inventory (Months) | Re-list Rate | Ask-Bid Gap (PPSF%) | Pending-to-Active Ratio | First-Attempt Median DOM | Median Total DOM After Relisting |
|---|---|---|---|---|---|---|
| Fort Myers | 2.2 | 23.9% | 4.9% | 22.1% | 66 days | 246 days |
| Cape Coral | 2.1 | 19.8% | 5.2% | 26.5% | 48 days | 219 days |
| Estero | 1.9 | 20.1% | 4.0% | 31.6% | 63 days | 240 days |
| Bonita Springs | 1.9 | 22.3% | 16.0% | 22.6% | 82 days | 256 days |
| Naples | 1.9 | 23.4% | 7.1% | 21.6% | 74 days | 258 days |
Source: FGCMLS. Single-month data unless otherwise noted. Proprietary metrics use Worthington’s address-matched property export, so active-listing denominators differ slightly from the published MLS counts in Table 1. Competitive Inventory MOI divides the filtered active-listing count by the city’s total trailing-three-month closing pace. It is a supplemental indicator and is not calculated the same way as published MLS months of supply.
City Snapshots
Fort Myers Market August 2026
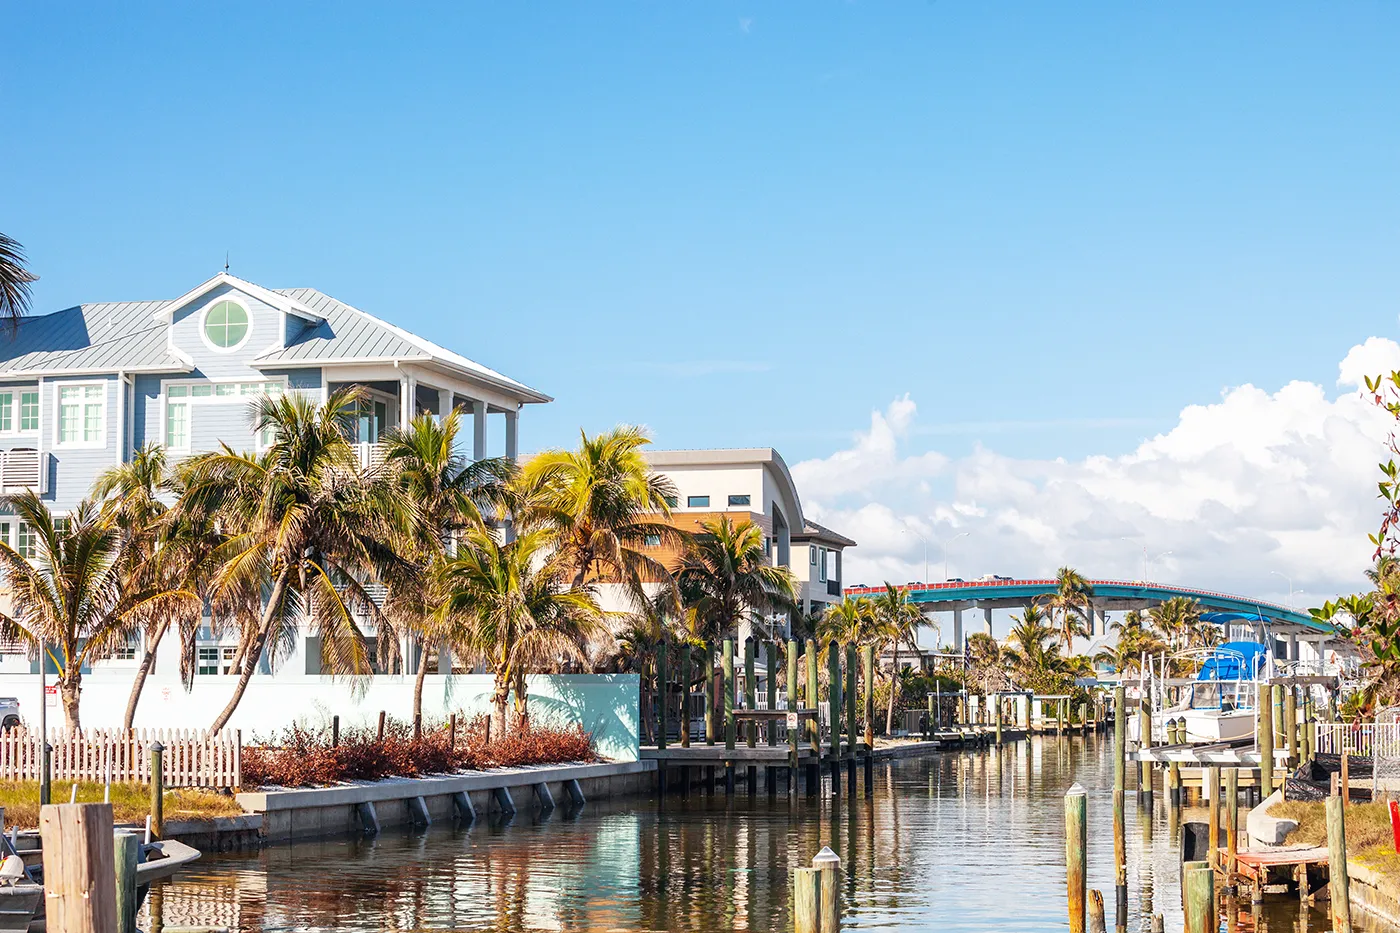
Fort Myers price per square foot reached $201 in August 2026, a second consecutive monthly increase after $192 in June and $198 in July. It remains 2.9% below August 2025, and the median sale price of $345,000 matched last August. Pending contracts rose 21.4% year over year. That is a short-term improvement, not yet evidence that the longer decline has ended.
- Active Listings
- 2,447
- Sold (Last 120 Days)
- 1,875
- Months of Supply
- 5.2 overall, 2.2 Competitive Inventory
- Median Sold Price
- $345,000
- Sellers Received
- 95.7%
- Re-list Rate
- 23.9%
- Pending-to-Active Ratio
- 22.1%
Read the full Fort Myers market report · Search Fort Myers homes for sale

Cape Coral Market August 2026
Cape Coral recorded 695 new listings in August 2026, up 13.2% from August 2025. Active inventory was still 22.4% lower than a year earlier. Sales, withdrawals and other listing-status changes all affect the active count. Cape Coral recorded a 97.7% sale-to-list ratio and a 19.8% Re-list Rate.
- Active Listings
- 2,441
- Sold (Last 120 Days)
- 2,103
- Months of Supply
- 4.8 overall, 2.1 Competitive Inventory
- Median Sold Price
- $382,375
- Sellers Received
- 97.7%
- Re-list Rate
- 19.8%
- Pending-to-Active Ratio
- 26.5%
Read the full Cape Coral market report · Search Cape Coral homes for sale

Estero Market August 2026
Estero active listings fell 32.5% year over year to 441, and months of supply reached 3.5. Monthly contract counts have moved sharply in both directions, with pending sales down 20.0% in July and up 34.1% in August. Estero closes roughly 100 homes a month, so a single-month percentage swings on a couple dozen transactions.
- Active Listings
- 441
- Sold (Last 120 Days)
- 503
- Months of Supply
- 3.5 overall, 1.9 Competitive Inventory
- Median Sold Price
- $517,500
- Sellers Received
- 95.9%
- Re-list Rate
- 20.1%
- Pending-to-Active Ratio
- 31.6%
Read the full Estero market report · Search Estero homes for sale
Bonita Springs Market August 2026
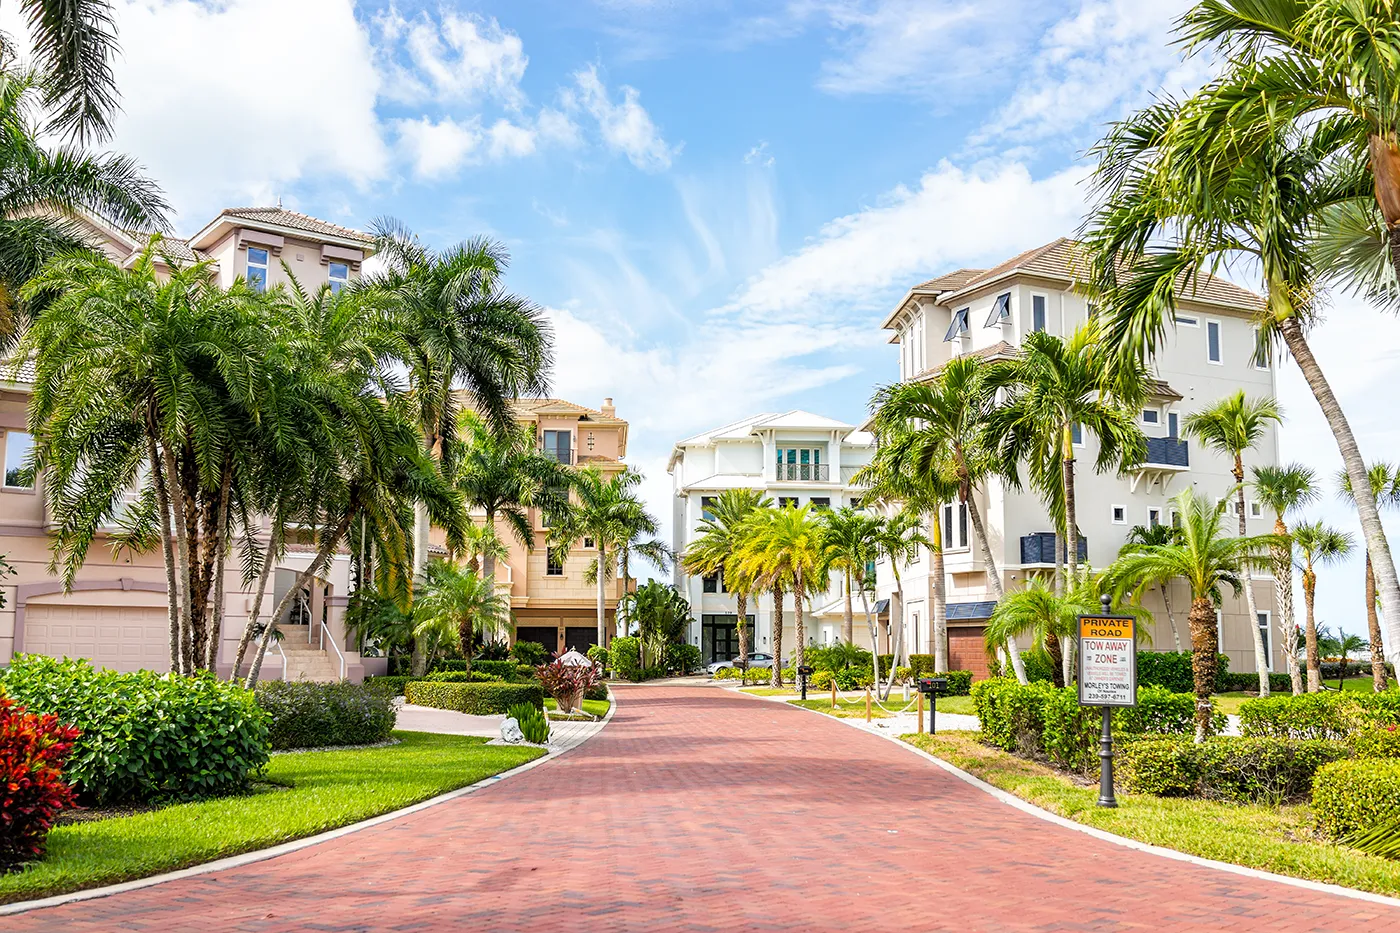
Bonita Springs median days on market reached 108 in August 2026 against 79 a year earlier. Pending contracts fell 9.9% to 127. The three-month rolling median moved from $570,000 in June to $520,000 in August, and rolling price per square foot moved from $314 to $292. Recent price measures have moved lower, though closing mix and property differences also affect those figures.
- Active Listings
- 668
- Sold (Last 120 Days)
- 590
- Months of Supply
- 4.3 overall, 1.9 Competitive Inventory
- Median Sold Price
- $505,000
- Sellers Received
- 95.1%
- Re-list Rate
- 22.3%
- Pending-to-Active Ratio
- 22.6%
Read the full Bonita Springs market report · Search Bonita Springs homes for sale
Naples Market August 2026
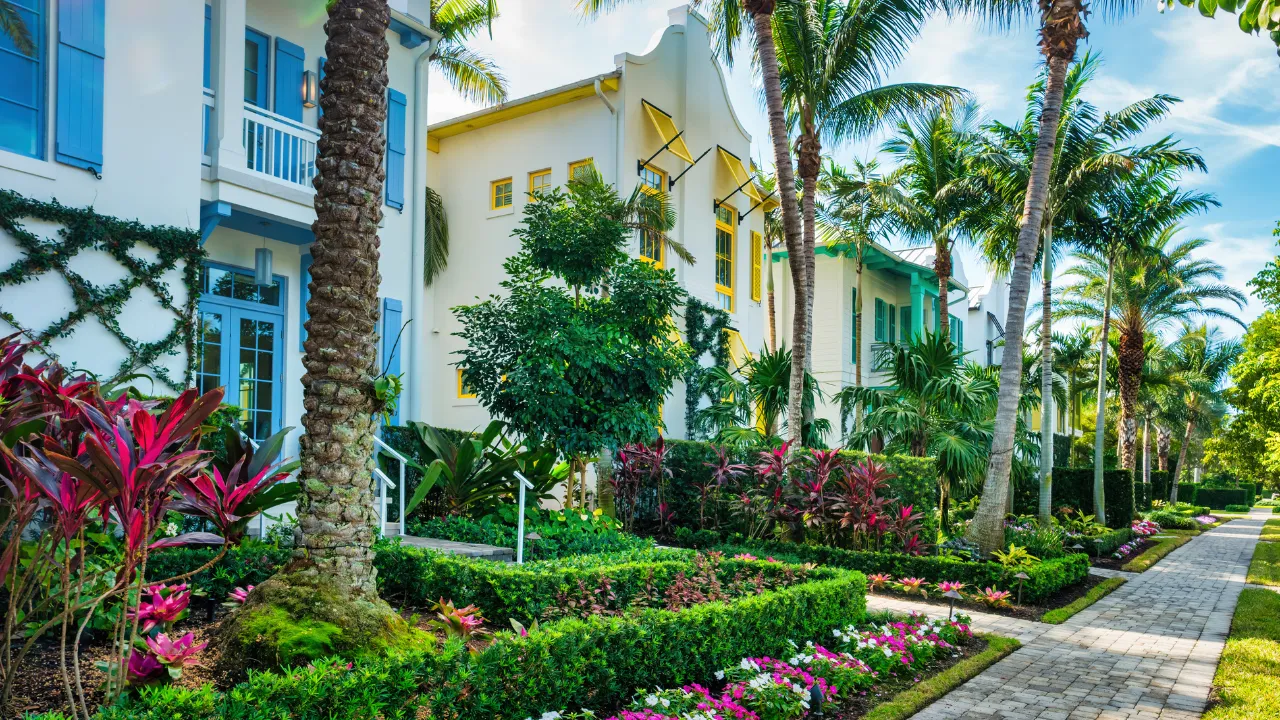
Naples median sale price rose 1.7% year over year to $610,000 and price per square foot rose 1.5% to $328. New listings fell 20.1% to 703. Of those returning listings, 49.7% came back at the same price or with a reduction under 3%.
- Active Listings
- 3,858
- Sold (Last 120 Days)
- 2,985
- Months of Supply
- 5.2 overall, 1.9 Competitive Inventory
- Median Sold Price
- $610,000
- Sellers Received
- 95.5%
- Re-list Rate
- 23.4%
- Pending-to-Active Ratio
- 21.6%
Read the full Naples market report · Search Naples homes for sale
Monthly market updates
Get the Southwest Florida market in your inbox.
Median price, inventory, and what’s selling across the five cities, once a month.
Frequently Asked Questions
Did Southwest Florida home prices rise or fall in August 2026?
The regional median sale price was $399,000, up 2.3% from August 2025, and price per square foot was $234, up 0.4%. City-level results are in Table 1 and in each city report.
How long did homes take to sell in Southwest Florida in August 2026?
The regional median was 63 days, down from 72 in August 2025. Homes that sold on their first listing attempt reached a contract faster than homes that had been listed before, and each city report carries both figures for its own market. The two groups differ in price, property type and condition.
Is 5.4 months of supply a buyer’s market or a seller’s market?
Four to six months is generally read as balanced, so 5.4 sits inside that range. Months of supply compares the listing count to the recent sales pace. It says less about price than a seller’s market call suggests. Regional supply fell 30.8% over the past year while price per square foot moved 0.4%. Season matters as well, since peak buying here runs January through April, and an August figure reflects a slower period. Conditions differ by city and price range, so the regional number describes neither end well.
Final Thoughts
Fewer homes closed in Southwest Florida in August than a year ago, but more went under contract, and fewer were available to buy. For a specific property, use its city, price range and comparable sales rather than the regional average.
Most homeowners feel overwhelmed when it’s time to move. At Worthington Realty, we provide personalized guidance and clear communication so that you feel heard, valued, and confident in your decisions.
– Search Southwest Florida homes for sale
– Contact the Worthington Realty team
– Get notified when next month’s report publishes
*All data referenced in Worthington’s market reports draws from the Florida Gulf Coast MLS (FGCMLS via Stellar MLS) unless otherwise noted.*
What’s Your Southwest Florida Home Worth?
Pricing to real, recent comparables is what separates a quick sale from months on market. Start with your address. A Worthington agent follows up with a pricing range, the comparable sales behind it, and the next steps that fit your timing.
Your information stays with Worthington Realty and is never sold or shared.
Get the Southwest Florida Market in Your Inbox
Median price, inventory, and what’s selling across Fort Myers, Cape Coral, Estero, Bonita Springs, and Naples, once a month.
