


This is a past report. It covers Estero market data for August 2026. For current numbers, see our Estero housing market page.
Estero Months of Supply Fell to 3.5 in August From 6.3 a Year Earlier
Price / Sq Ft
$250
Median Sold Price
$517,500
Active Listings
441
Months of Supply
3.5
Estero months of supply came in at 3.5 in August, down from 6.3 a year earlier. The active listing count fell by roughly a third over the same period.
Prices read differently depending on the window, with the single-month median up 6.2% and the three-month rolling measure of price per square foot down 1.6%. Regional context is in the Southwest Florida market report for August 2026.
*Unless otherwise noted, housing-market figures come from the Florida Gulf Coast MLS (FGCMLS via Stellar MLS), pulled September 1, 2026. Data reflects MLS records as of the date the monthly analysis file was prepared. MLS figures may update as late transactions are recorded.*
Key Takeaways
- Estero months of supply fell to 3.5 from 6.3 a year earlier, a 44.4% decline.
- Active listings dropped to 441, down 32.5% year over year.
- Pending sales reached 110 in August, up 34.1%, after a 20.0% decline in July. Showings per listing reached 4.0 against 3.0 a year earlier.
- The three-month rolling median finished August at $517,000. Rolling price per square foot slipped to $248 from $257 in May and June.
- Homes that sold on their first listing attempt took a median of 63 days. Homes that sold after an earlier listing attempt took a median of 240 days across all of them.
Estero Months of Supply Reached 3.5 as the Active Count Fell by a Third
Estero months of supply was 3.5 in August 2026 against 6.3 in August 2025. That is a 44.4% year-over-year decline.
Months of supply divides the current active listing count by a sales pace. It answers a single question: how long the listed homes would take to sell through at the recent sales rate.
Active listings finished the month at 441, down 32.5% from 653 a year earlier. The count has fallen in each month since May, standing at 518 in June and 480 in July. New listings came in at 124, down 19.5% from 154.
The active count falls for several reasons at once, including completed sales, expirations and withdrawals. A decline of this size shows the pool of available homes shrinking. It does not by itself establish how much of that came from buyers.
Season shapes months of supply as well. Southwest Florida’s peak buying period runs January through April, the reverse of most of the country. Activity thins from May into September. The year-over-year comparison carries more weight here than the move from July.
Pending Sales and Showings Rose From Last August
It took a median of 9 showings to produce a contract against 5 last August. Median days on market fell to 63 from 112.
Closed sales totaled 90 against 92, down 2.2%. Dollar volume reached $59.3 million, up 13.9% year over year.
Pending contracts moved sharply in both directions this summer. July came in 20.0% below the prior year, but August rose 34.1% to 110. Estero closes roughly 100 homes a month. At that volume a single-month percentage swings hard on a couple dozen transactions.
The three-month figures smooth that path. Estero closed 322 homes in the three months through August against 294 a year earlier, up 9.5%. Rolling pending sales reached 295 against 288, up 2.4%.
Shadow inventory refers to homes whose owners have moved toward selling without an active MLS listing in place. Worthington reads this pool directionally rather than publishing a count. Roughly one in eight Estero listings that left the MLS in August had returned by the pull date.
Estero Prices Rose on the Median While the Rolling Value Measure Slipped
Estero prices read differently depending on the window. The August median sale price was $517,500, up 6.2% from $487,450, and single-month price per square foot held at $250.
The August median covers 90 closings. The rolling figure combines June, July and August, reducing the influence of one unusual group of sales. The rolling figures carry the price comparisons here.
The rolling median finished August at $517,000, up 3.4% year over year. Its monthly path ran $500,000 in May, $520,000 in June and $510,000 in July. Rolling price per square foot went the opposite way, holding at $257 in May and June. It eased to $253 in July and $248 in August, which is 1.6% below last August.
Those two measures describe different things. The median tracks the middle sale price, and it moves with the size and tier of whatever closed. Price per square foot adjusts for home size. A change in the mix of homes selling is one explanation for a median rising while per-square-foot values slip. Location, condition and property type move both figures too.
A homeowner cannot read the 6.2% median increase as the change in their own home’s value. That figure describes the middle of a citywide pool of closings. The rolling per-square-foot number adds size-adjusted context, and it has drifted lower since May.
Sellers received a median of 95.9% of their most recent asking price, up from 95.1% a year earlier. The sold-to-list ratio has held between 95.9% and 96.5% since May. It describes where closings landed across the city as a whole. Read it as market context rather than as a guide to any one negotiation.
Roughly One in Five Active Estero Listings Had an Earlier Listing Attempt
The Re-list Rate covers active listings that carry an earlier expired, withdrawn or terminated record at the same address. The window is the past 12 months. Estero’s reading is 20.1%, covering 88 of the 437 active listings in the address-matched export. That is down from 22.4% in July. Estero ran 20.9% in June, so the rate is close to where it stood two months ago. A lower Re-list Rate means fewer active homes carry an expired, withdrawn or terminated listing at the same address from the previous 12 months. The data does not establish why those earlier listings ended.
Of those returning listings, 56.8% came back at 3% or more below the prior asking price. The remaining 43.2% were relisted with little or no price change.
Estero recorded 399 sales of homes that sold on their first listing attempt in the trailing 120 days. Those took a median of 63 days and closed at a median of $516,500. Homes that sold after an earlier listing attempt accumulated a median of 240 days across their attempts. That group covered 80 sales, or 15.9% of closings in the window. Within it the median earliest asking price was $593,950. The median final sale price was $547,750, a median per-home difference of $48,500.
Those two groups are not the same homes. They differ in price, property type, condition and seller circumstances. The higher earliest asking price in the second group reflects a different set of properties. The figures describe how each group performed. They do not establish that an earlier listing attempt or an opening price produced the difference.
When a home returns to the MLS under a new listing, its days-on-market counter starts over at zero. The days-on-market number shown on an active listing may not reflect its cumulative marketing time across listing attempts.
For Estero sellers
Curious what your Estero home would bring in today’s market?
Get a Worthington pricing analysis built from the same MLS data behind this report.
Estero Competitive Inventory and Ask-Bid Gap
Competitive Inventory is Worthington’s filtered view of active listings. It sets aside homes that have been listed at least 180 days without a price reduction of 3% or more, along with relisted homes that returned with less than a 3% change. It uses the city’s three-month closing pace, while published MLS months of supply uses all active listings and a 12-month pace. The two figures answer different questions and should not be read as interchangeable.
On Estero’s trailing three-month pace of 107.3 closings a month, all 437 export listings run 4.1 months. Removing the 93 listings at 180 days or more brings that to 3.2 months. The full filter leaves 199 listings at 1.9 months.
The Ask-Bid Gap compares two medians. The first is the asking price per square foot of active listings. The second is the price per square foot of recent closings in the same price range. Estero’s citywide reading is 4.0%. Active listings ask a median $264.96 against $254.34 on trailing 120-day sales. By tier it runs 2.5% below $400,000, 3.0% from $400,000 to $750,000, and 5.7% from $750,000 to $1.5 million. Above $1.5 million it reaches 16.4%, where 28 active listings ask a median $692.44 against $578.54 on 22 sales.
The $750,000 to $1.5 million tier read -6.0% in June and -2.2% in July. Asking prices in that range sat below recent closings earlier in the summer and now sit modestly above them. The active homes and the sold homes are not the same properties. They can differ in condition, location, age and finish. This measure shows how closely the two groups line up. It does not set an offer percentage, and it does not predict any single home’s sale price or marketing time.
The Pending-to-Active Ratio compares homes under contract to homes available at the pull date. It is a snapshot of activity levels rather than a conversion rate. Pending contracts are not part of the months-of-supply calculation.
Table 1: Core Market Metrics, August 2026
Read this city’s figures against its own recent history.
| City | Median Sold Price | Median Price per Sq. Ft. | Active Listings | Months of Supply | Sold-to-List | Closed Sales YoY |
|---|---|---|---|---|---|---|
| Fort Myers | $345,000 (0.0%) | $201 (-2.9%) | 2,447 (-20.0%) | 5.2 (-30.7%) | 95.7% | -5.5% |
| Cape Coral | $382,375 (+6.8%) | $222 (+3.3%) | 2,441 (-22.4%) | 4.8 (-31.4%) | 97.7% | -5.0% |
| Estero | $517,500 (+6.2%) | $250 (0.0%) | 441 (-32.5%) | 3.5 (-44.4%) | 95.9% | -2.2% |
| Bonita Springs | $505,000 (+0.5%) | $287 (-2.0%) | 668 (-30.2%) | 4.3 (-41.1%) | 95.1% | -14.8% |
| Naples | $610,000 (+1.7%) | $328 (+1.5%) | 3,858 (-23.2%) | 5.2 (-35.0%) | 95.5% | -5.8% |
Source: FGCMLS. Single-month data unless otherwise noted. Sold-to-list uses most recent list price at time of contract.
Table 2: Worthington Market Lens, August 2026
| City | Competitive Inventory (Months) | Re-list Rate | Ask-Bid Gap (PPSF%) | Pending-to-Active Ratio | First-Attempt Median DOM | Median Total DOM After Relisting |
|---|---|---|---|---|---|---|
| Fort Myers | 2.2 | 23.9% | 4.9% | 22.1% | 66 days | 246 days |
| Cape Coral | 2.1 | 19.8% | 5.2% | 26.5% | 48 days | 219 days |
| Estero | 1.9 | 20.1% | 4.0% | 31.6% | 63 days | 240 days |
| Bonita Springs | 1.9 | 22.3% | 16.0% | 22.6% | 82 days | 256 days |
| Naples | 1.9 | 23.4% | 7.1% | 21.6% | 74 days | 258 days |
Source: FGCMLS. Single-month data unless otherwise noted. Proprietary metrics use Worthington’s address-matched property export, so active-listing denominators differ slightly from the published MLS counts in Table 1. Competitive Inventory MOI divides the filtered active-listing count by the city’s total trailing-three-month closing pace. It is a supplemental indicator and is not calculated the same way as published MLS months of supply.
August 2026 Opening-Price Results for Estero Communities
The final line in each profile compares eligible August closings with the opening asking price of the listings that sold. Results are calculated property by property before the median is reported. Sample sizes appear with every result, and small samples describe only those particular sales.
Bella Terra
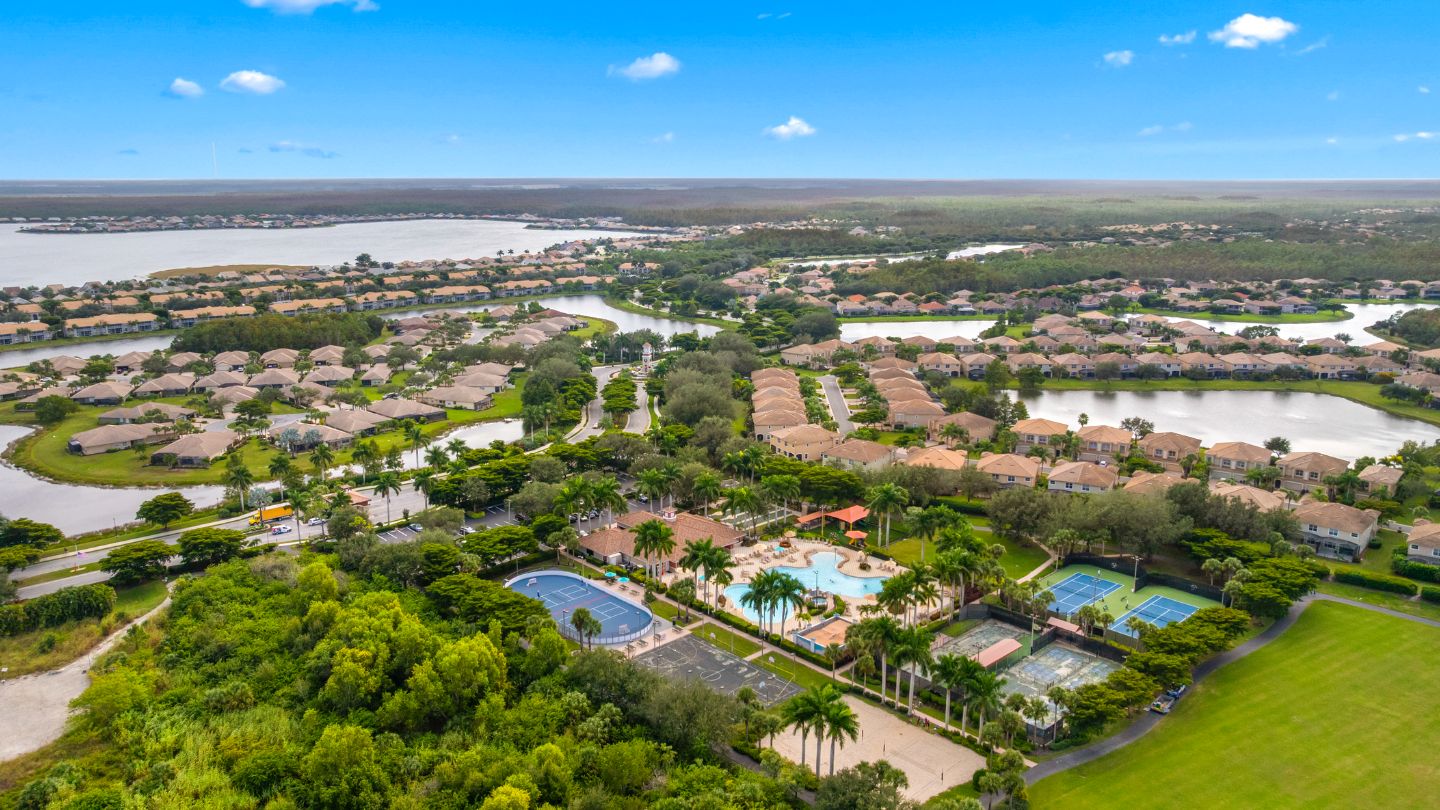
Supply grew here while contracts pulled back, with active listings up 31.6% to 25 and the pending-to-active ratio down 29.9 points to 28.0%. Months of inventory moved from 1.6 to 2.3 against 44 closings. Sellers received 97.6% of final asking price, and the seven August closings finished at a median 96.1% of their opening price, $22,000 below it, with two relists among them. Closings covered condos through single-family homes, with Barletta at $253,750 against a $449,500 community median, so comparables should match product type rather than the blended figure.
View 7 more indicators
- Closing Range (Last 120 Days)
- $242,500 to $780,000 across 44 sales
- Active Listings
- 25up 31.6% MoM
- Closings (Last 120 Days)
- 44down 10.2% MoM
- Pending Contracts
- 7down 36.4% MoM
- Re-list Rate
- 8.0%down 13.1 pts MoM
- Sellers Received
- 97.6% of final list pricedown 0.1 pts MoM
- Sellers Received vs Original Ask
- 96.1% of the listing’s opening price (n=7), a median $22,000 below it
Cascades at Estero
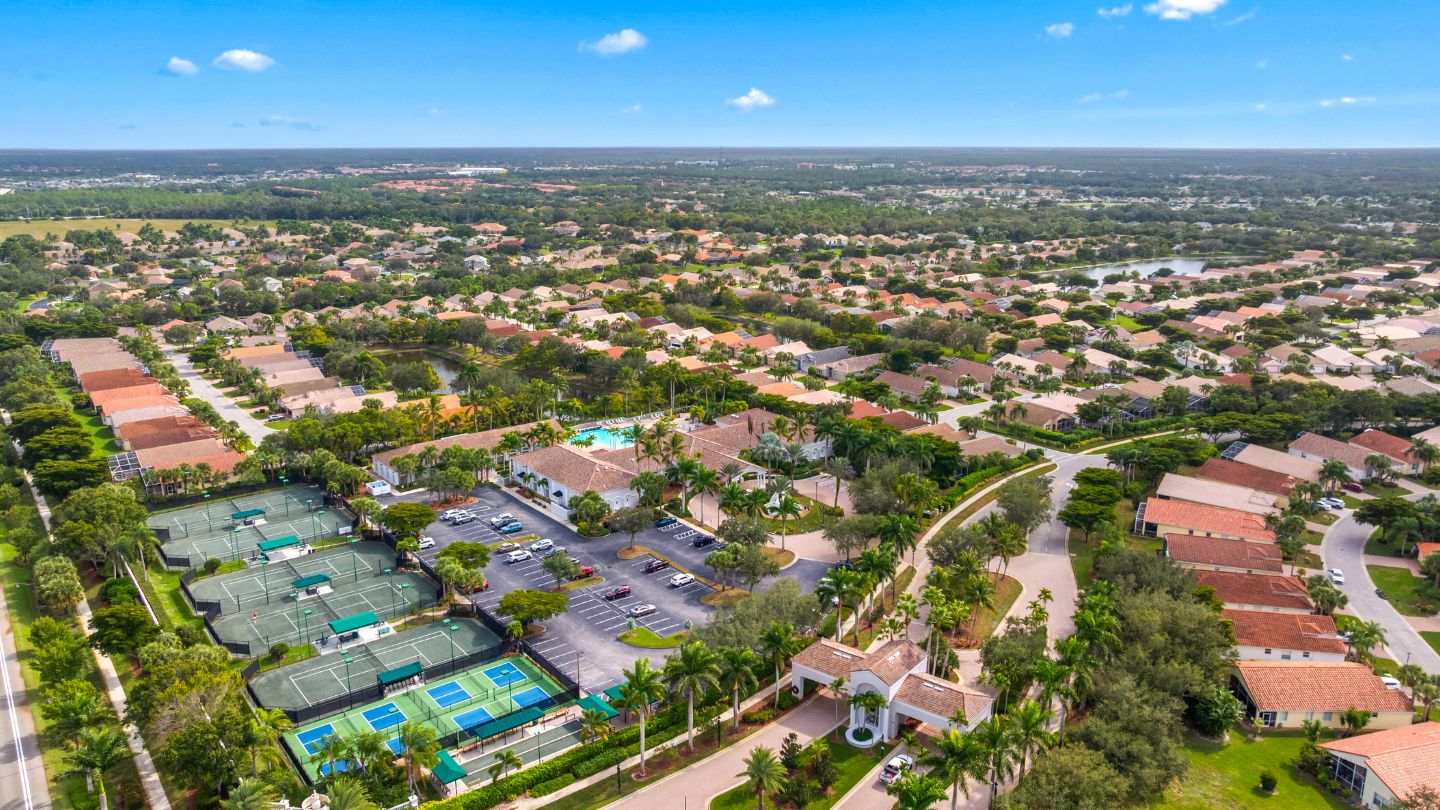
More homes sit under contract here than are available to buy, five pending against four active listings for a 125.0% pending-to-active ratio, with months of inventory holding at 1.8. None of the four active listings carries a prior expired, withdrawn or terminated record. The two August closings finished at a median 97.9% of their opening price, $9,025 below it, and neither was a relist. Two closings cannot support a benchmark. Comparables in this 55-plus community should match floor plan, since the Aruba, Montego and St. Kitts plans differ materially in size.
View 7 more indicators
- Closing Range (Last 120 Days)
- $275,000 to $586,500 across 9 sales
- Active Listings
- 4down 33.3% MoM
- Closings (Last 120 Days)
- 9down 30.8% MoM
- Pending Contracts
- 5up 25.0% MoM
- Re-list Rate
- 0.0%down 16.7 pts MoM
- Sellers Received
- 95.5% of final list priceup 0.3 pts MoM
- Sellers Received vs Original Ask
- 97.9% of the listing’s opening price (n=2), a median $9,025 below it
Grandezza
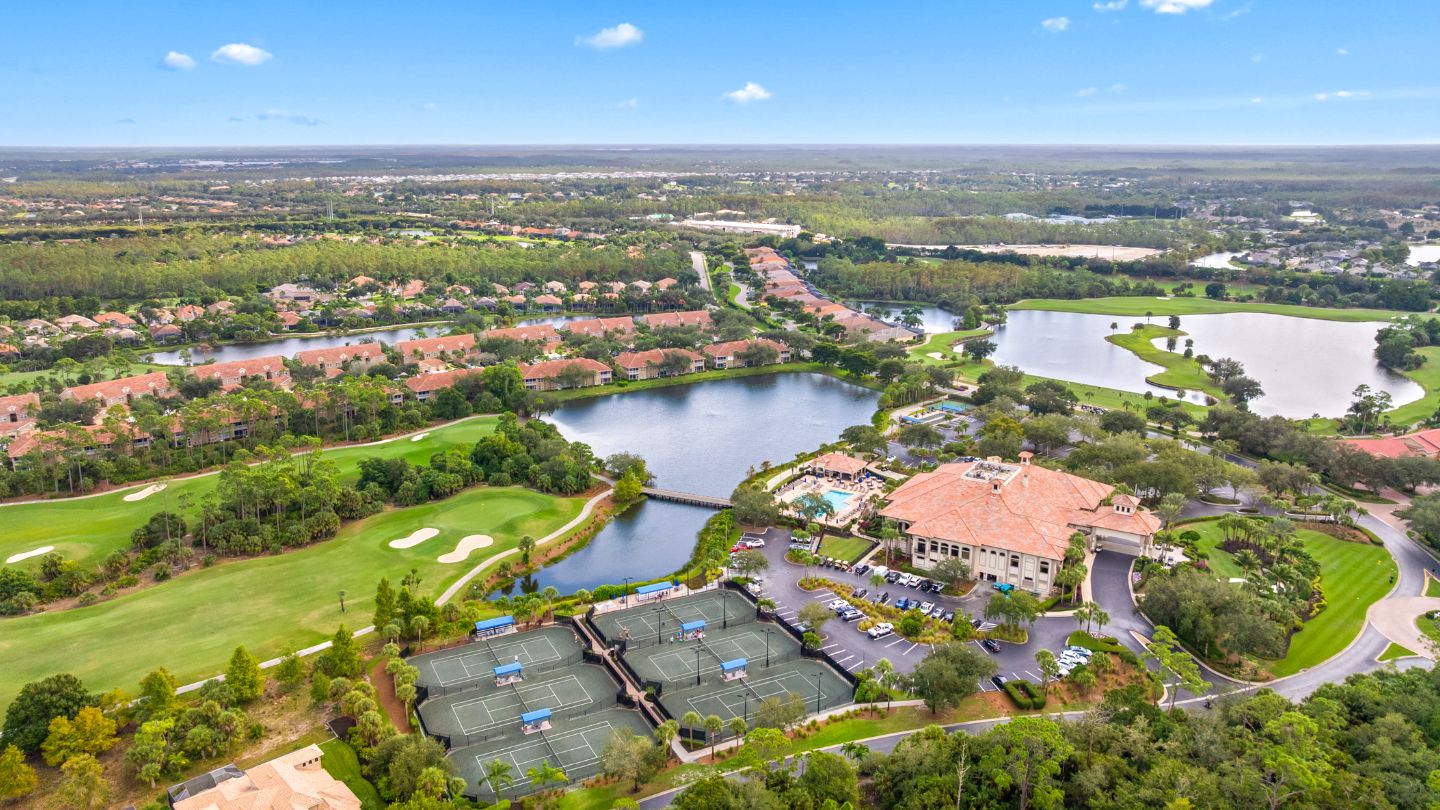
Just over a third of active listings carry a prior expired, withdrawn or terminated record. Months of inventory moved from 2.5 to 2.8 on 14 active listings and 20 closings, and the active pool asks a median $460,000 on homes smaller than those that sold at $599,500. Three of the four August closings carried an opening price and finished at a median 86.9% of it, $49,900 below, with two of the four classified as relists. Closings spanned Sabal Palm at $285,000 through Savona at $636,000, so comparables should match neighborhood.
View 7 more indicators
- Closing Range (Last 120 Days)
- $225,000 to $2,600,000 across 20 sales
- Active Listings
- 14up 7.7% MoM
- Closings (Last 120 Days)
- 20down 4.8% MoM
- Pending Contracts
- 3flat MoM
- Re-list Rate
- 35.7%up 4.9 pts MoM
- Sellers Received
- 95.0% of final list pricedown 0.2 pts MoM
- Sellers Received vs Original Ask
- 86.9% of the listing’s opening price (n=3 of 4 with an opening price), a median $49,900 below it
Stoneybrook
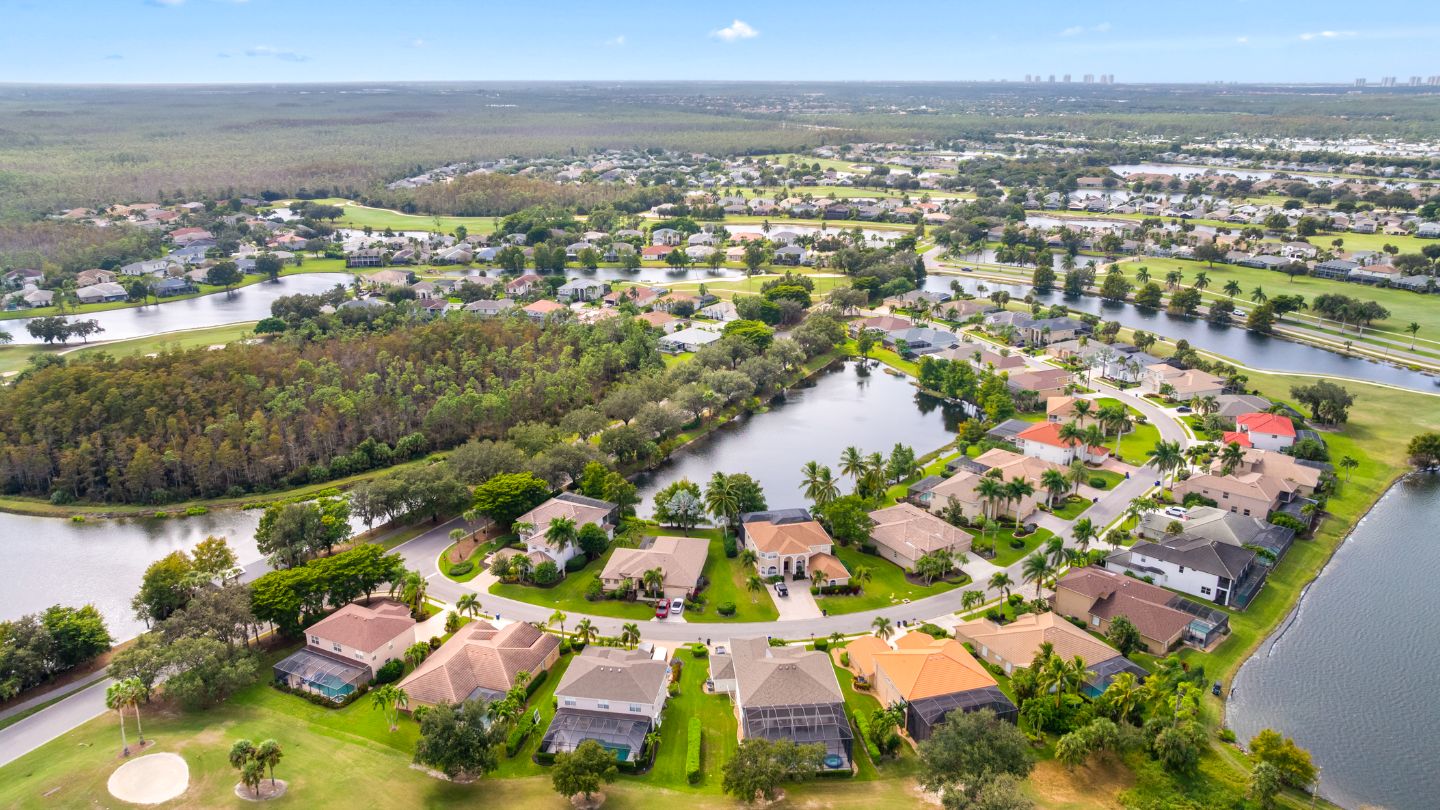
Contracts jumped here, with five pending against eight active listings lifting the pending-to-active ratio 42.5 points to 62.5%, while months of inventory held at 2.7. Closings across the trailing 120 days totaled 12 at a $519,950 median, weighted toward single-family homes. The two August closings finished at a median 92.7% of their opening price, $45,000 below it, with one of the two a relist. Two closings cannot support a benchmark. With condos, villas and single-family homes all trading here, comparables should match product type and golf access arrangement.
View 7 more indicators
- Closing Range (Last 120 Days)
- $249,000 to $765,000 across 12 sales
- Active Listings
- 8down 20.0% MoM
- Closings (Last 120 Days)
- 12down 20.0% MoM
- Pending Contracts
- 5up 150.0% MoM
- Re-list Rate
- 37.5%up 7.5 pts MoM
- Sellers Received
- 96.8% of final list pricedown 0.9 pts MoM
- Sellers Received vs Original Ask
- 92.7% of the listing’s opening price (n=2), a median $45,000 below it
Verdana Village
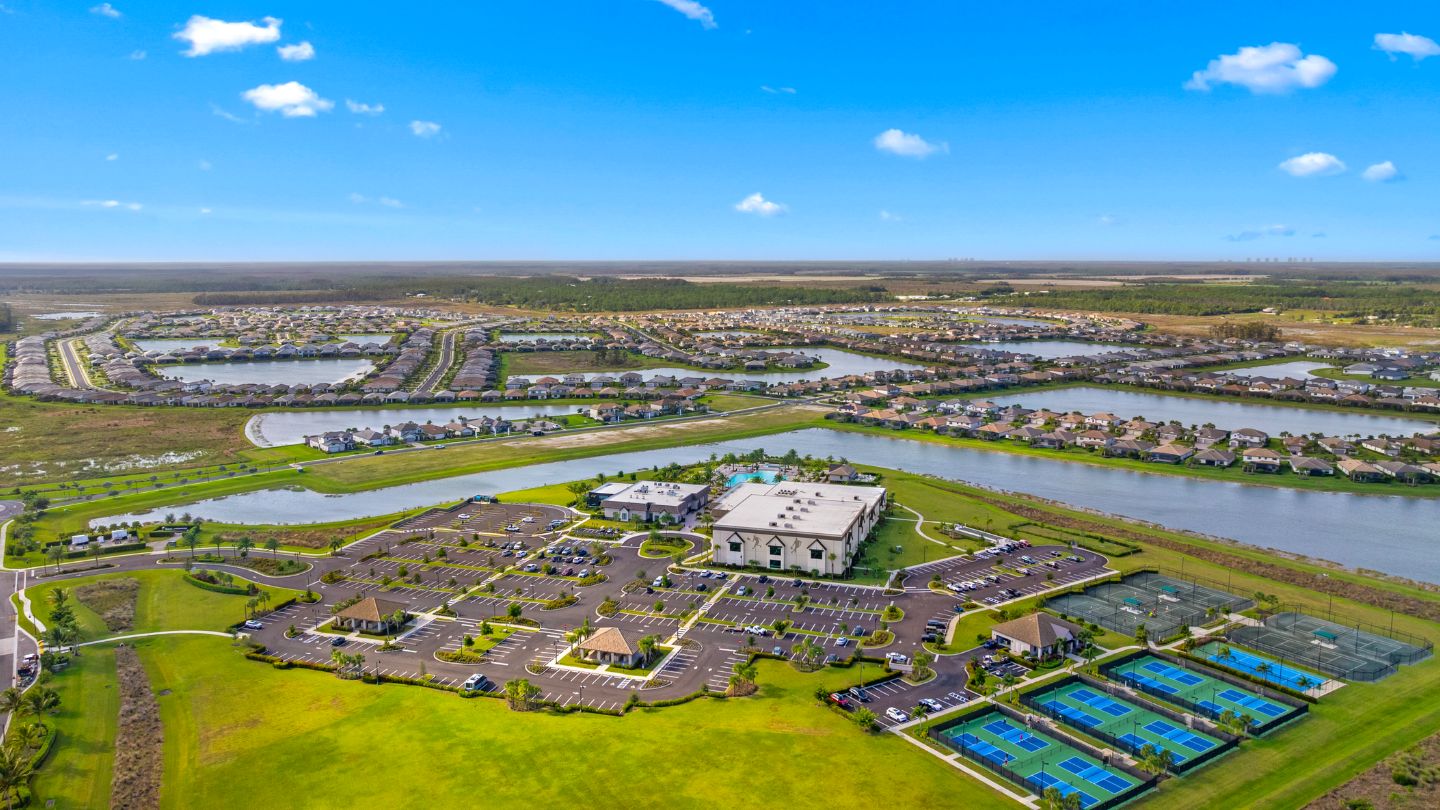
Over the trailing 120 days, sellers received a median 98.4% of final asking price, up for a second consecutive month. Among the nine eligible August closings, the median was 96.4% of final ask and 96.2% of opening ask, a difference of 0.2 points. None of the 10 was classified as a relist. The remaining closing was a Sold Data Entry record without MLS listing history, so no opening asking price was available. Months of inventory sits at 2.3 across 34 active listings and 59 closings. Comparables should match builder series, since product spans 1,405 to 5,300 square feet.
View 7 more indicators
- Closing Range (Last 120 Days)
- $363,000 to $1,250,000 across 59 sales
- Active Listings
- 34flat MoM
- Closings (Last 120 Days)
- 59down 3.3% MoM
- Pending Contracts
- 13up 30.0% MoM
- Re-list Rate
- 11.8%down 8.8 pts MoM
- Sellers Received
- 98.4% of final list priceflat MoM
- Sellers Received vs Original Ask
- 96.2% of the listing’s opening price (n=9 of 10 with an opening price), a median $20,000 below it
The Place at Corkscrew
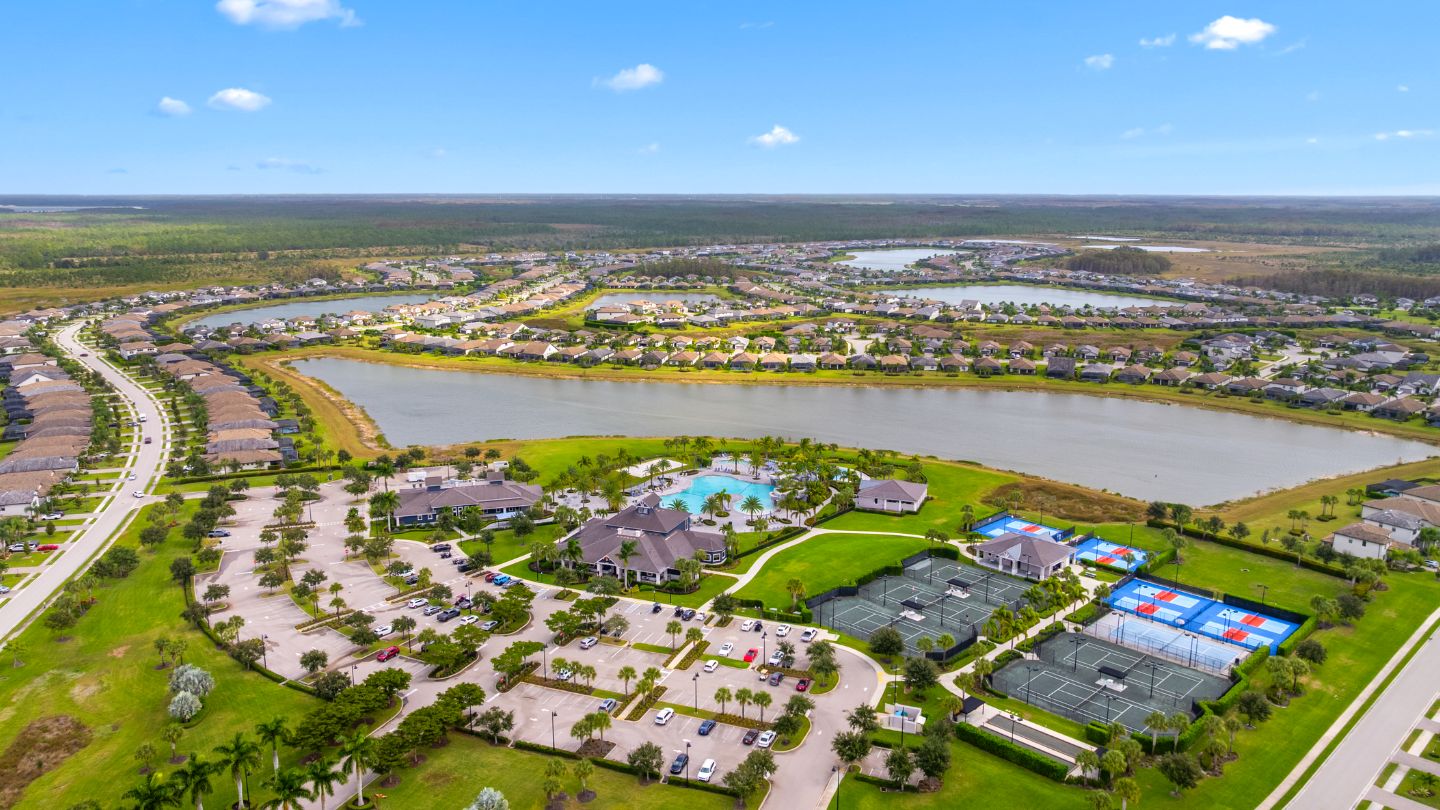
None of the 17 active listings carries a prior expired, withdrawn or terminated record, down from 11.1% in July. Months of inventory moved from 1.6 to 2.0 against 34 closings, and sellers received 97.4% of final asking price. The five August closings finished at a median 96.0% of their opening price, $29,000 below it, with two of the five classified as relists. All product here is single-family from two builders, so comparables should match floor plan and lot position rather than product type.
View 7 more indicators
- Closing Range (Last 120 Days)
- $508,000 to $1,220,000 across 34 sales
- Active Listings
- 17down 5.6% MoM
- Closings (Last 120 Days)
- 34down 24.4% MoM
- Pending Contracts
- 8down 20.0% MoM
- Re-list Rate
- 0.0%down 11.1 pts MoM
- Sellers Received
- 97.4% of final list priceup 0.3 pts MoM
- Sellers Received vs Original Ask
- 96.0% of the listing’s opening price (n=5), a median $29,000 below it
Monthly market updates
Get the Southwest Florida market in your inbox.
Median price, inventory, and what’s selling across the five cities, once a month.
Frequently Asked Questions About the Estero Market
Is 3.5 months of supply a buyer’s market or a seller’s market?
Four to six months is generally read as balanced, so 3.5 sits below that range on the seller side. That describes the supply picture. Estero rolling price per square foot finished August at $248 against $252 a year earlier, a decline of 1.6%. Estero’s 3.5-month reading describes relatively limited supply. Supply alone does not establish the direction of prices. August also falls in the slower half of the local calendar, and conditions differ by price range.
Did Estero home values rise 6.2% over the past year?
That figure is the change in the August median sale price, which covers one month of closings. The three-month rolling median rose 3.4% over the same period while rolling price per square foot fell 1.6%. Those measures use different windows and treat home size differently. None of them describes the change in value of a specific property.
How much below asking should a buyer offer in Estero?
The data does not support a single answer. Citywide, closings landed at a median 95.9% of the most recent asking price. That is market context rather than a target for an individual offer. Above $1.5 million the Ask-Bid Gap is wider than in any other Estero price tier. Offers there are better built from comparable sales than from the asking price.
What to Watch in Estero in September
Estero enters the fall with 3.5 months of supply, its lowest August reading since 2023. Buyer traffic is running ahead of last year. The price picture there is less settled than the supply picture. The rolling median has held near its year-ago level. Rolling price per square foot has moved down in each of the past two months.
That rolling per-square-foot reading is worth watching in September. Another decline would extend the current direction. A stable reading would end the two-month decline without establishing what produced it.
An Estero pricing decision still depends on the community, price range, condition and closest comparable sales.
– Search Estero homes for sale
– Contact the Worthington Realty team
– Get notified when next month’s report publishes
Most homeowners feel overwhelmed when it’s time to move. At Worthington Realty, we provide personalized guidance and clear communication so that you feel heard, valued, and confident in your decisions.
*All data referenced in Worthington’s market reports draws from the Florida Gulf Coast MLS (FGCMLS via Stellar MLS) unless otherwise noted.*
What’s Your Estero Home Worth?
Pricing to real, recent comparables is what separates a quick sale from months on market. Start with your address. A Worthington agent follows up with a pricing range, the comparable sales behind it, and the next steps that fit your timing.
Your information stays with Worthington Realty and is never sold or shared.
Get the Southwest Florida Market in Your Inbox
Median price, inventory, and what’s selling across Fort Myers, Cape Coral, Estero, Bonita Springs, and Naples, once a month.
