


Southwest Florida prices split by city in July, with Cape Coral and Naples rising while regional inventory kept falling.
Price / Sq Ft
$231
Median Sold Price
$395,000
Active Listings
15,456
Months of Supply
5.6
The regional price measures barely moved in July, which makes it easy to miss how different the city-level results were. Southwest Florida’s median sale price rose 1.3% year over year while price per square foot slipped 0.4%, and the individual cities moved in opposite directions. This report draws on Florida Gulf Coast MLS data for the full region, and the five city reports linked below use the same dataset. Property-level figures reflect the August 3 data pull, while published inventory and months of supply reflect the July month-end reporting period. Figures may update as late transactions are recorded.
Key Takeaways
- Regional median sale price rose 1.3% year over year to $395,000, while price per square foot slipped 0.4% to $231. City-level results differed considerably.
- Pending sales rose 14.5% year over year to 2,644 and closed sales rose 5.4% to 2,580, the region’s 14th straight month of year-over-year closing growth on currently reported figures.
- Active inventory fell 22.9% to 15,456 listings, and months of supply fell to 5.6, down from 8.5 a year ago and 6.1 in June.
- Cape Coral and Naples rose on both median and price per square foot, Fort Myers and Bonita Springs softened, and Estero’s single-month median jumped 11.1% while its three-month rolling median rose just 1.6%, a reminder of how a low-volume month can mislead.
- Across the five featured cities, 16.1% of homes that closed in the last 120 days had relisted first, selling a median $50,050 below their earlier asking price, while Competitive Inventory ran from 1.5 months in Estero to 2.1 in Fort Myers and Cape Coral.
- Fort Myers price per square foot rebounded to $199 from June’s 30-month low of $193, its first monthly gain since April, though it remained 2.5% below a year ago.
Regional Snapshot at a Glance
Here is how the five featured cities compare with the broader Southwest Florida market this month. All year-over-year (YoY) columns compare against July 2025. A negative price or price-per-square-foot change means prices fell. A negative inventory or supply change means fewer homes were available than a year ago.
| City | Median Sold Price | Median YoY | Price/SF | Price/SF YoY | Active Listings | Active YoY | Months Supply | Months Supply YoY | Sold-to-List | Closed Sales | Closed YoY |
|---|---|---|---|---|---|---|---|---|---|---|---|
| Fort Myers | $331,000 | -1.2% | $199 | -2.5% | 2,533 | -22.9% | 5.4 | -32.5% | 95.7% | 418 | -0.2% |
| Cape Coral | $393,000 | +12.3% | $222 | +3.7% | 2,486 | -27.9% | 4.9 | -37.2% | 97.9% | 520 | +7.7% |
| Estero | $507,500 | +11.1% | $245 | -0.4% | 471 | -29.1% | 3.8 | -40.6% | 96.7% | 95 | -9.5% |
| Bonita Springs | $470,000 | -6.0% | $274 | -11.9% | 743 | -33.2% | 4.8 | -45.5% | 96.0% | 115 | -1.7% |
| Naples | $615,000 | +4.2% | $337 | +5.0% | 4,138 | -22.9% | 5.5 | -36.8% | 95.0% | 664 | +9.0% |
| Southwest Florida | $395,000 | +1.3% | $231 | -0.4% | 15,456 | -22.9% | 5.6 | -34.1% | 96.5% | 2,580 | +5.4% |
Swipe to view all columns →
Source: FGCMLS. Single-month data unless otherwise noted. Sold-to-list uses most recent list price at time of contract.
Note: The five featured cities’ active listings sum to 10,371, below the region-wide total of 15,456 above. Southwest Florida figures cover the full FGCMLS footprint, which includes areas outside the five cities featured in these reports, such as Lehigh Acres and Marco Island. This row is calculated from the full regional dataset, not an average of the five city rows above.
Closed and Pending Sales Both Finished Above Last Year
Closed sales show completed July transactions. Pending sales show how many homes were under contract, a more current look at activity, though not every contract will close.
The region closed 2,580 sales in July, up 5.4% from a year ago on currently reported figures, the 14th consecutive month of year-over-year growth. Because July closings are still preliminary and fill in as late transactions post, treat that streak as the reported count rather than a settled one. Pending sales, a more current measure of contract activity, rose 14.5% year over year to 2,644. Regional dollar volume rose about 26% to just under $1.8 billion, while the closing count increased 5.4%. That difference indicates a higher average value among July’s reported closings. Showings per listing rose to 3.3 from 2.7 a year ago, a sign that buyer traffic is heavier than it was last summer.
The regional pending gain was not even across the cities. Cape Coral’s pending pool ran 128.9% of its recent three-month closing pace, the strongest among the five featured cities, while Estero’s pending sales fell 21.8% and Bonita Springs slipped 1.8%.
Mortgage Rates Are Up From Their Winter Low
The 30-year fixed-rate mortgage averaged 6.66% for the week of July 30, 2026, per Freddie Mac’s Primary Mortgage Market Survey. Rates reached a 52-week low near 5.98% in late February and have moved in both directions week to week since then rather than rising in a straight line, sitting about 68 basis points above that low and modestly below where they stood a year ago. Even with rates up from the winter low, buyers stayed active this summer, with pending sales up 14.5% year over year and showings per listing up about 22%.
At the region’s $395,000 median price, a buyer putting 20% down and financing $316,000 at that rate would carry a principal-and-interest payment of about $2,031 a month. Estimated principal and interest only, based on 20% down at a 30-year fixed rate of 6.66%. Property taxes, homeowners and flood insurance, HOA dues, closing costs, and other expenses are not included. Actual rates and payments vary.
Active Inventory Keeps Falling
Active listings count every home currently for sale, fresh listings, relists, and stale inventory that has sat unsold for months, all counted equally. When relist activity is high, the new-listing count can overstate how much genuinely fresh supply is entering the market.
Active inventory across the full Southwest Florida market fell 22.9% year over year to 15,456. It helps to look at how that pool fills and drains. Regional inventory peaked near 25,800 listings in March 2025. It declined through much of 2025, built again during the 2025 to 2026 winter season, and resumed falling afterward. Over the past year, closings ran about 14% higher than the year before while new listings ran about 8% lower. Homes also left the market through expiration, withdrawal, or termination. Together, sales and other listing exits reduced the inventory carried forward from earlier months. July’s 3,507 new listings were basically flat from a year ago, and that steady inflow did not rebuild it. For buyers, that means less selection than last summer. For sellers, active competition is thinner than it was a year ago.
Months of Supply Tightened Again
Months of supply answers a specific question: if no new listings entered the market today, how many months would it take to sell through current inventory at the current pace? Six months is the traditional benchmark for a balanced market, though in Southwest Florida the season and the price tier matter as much as the number.
Regional months of supply fell to 5.6, down from 8.5 a year ago and 6.1 in June, the tightest reading so far in 2026. Months of supply compares available inventory with the recent sales pace. With fewer listings carried forward and more regional closings than a year ago, that ratio fell. All five featured cities sat below the regional 5.6-month figure. Naples came closest at 5.5 months, and Estero was the tightest at 3.8.
We like to dig a little deeper here, because the overall figure includes many listings that would not meet the Competitive Inventory criteria. Competitive Inventory focuses on active listings with fewer than 90 days on market that are either first-attempt listings or relists that returned at least 3% below their matched prior asking price. Older listings, and relists that came back without that pricing reset, are excluded. What remains is the supply that meets the Competitive Inventory criteria. Across the five cities, Competitive Inventory months of supply ran from 1.5 months in Estero to 2.1 in Fort Myers and Cape Coral, a fraction of the overall figures, reflecting how few current listings meet the Competitive Inventory criteria.
Relisted Homes Took Longer and Sold Below Earlier Asking Prices
Worthington’s Re-list Rate measures the share of today’s active listings that also had an expired, withdrawn, or terminated listing during the preceding 12 months. It shows how much of today’s active inventory has already been through an earlier listing attempt. One mechanical detail matters here: when a home relists, its days-on-market counter resets to zero, so total exposure can be understated unless the prior listing history is reviewed. A home relisting at 15 days may have already spent 200-plus days on the market during an earlier attempt.
Re-list Rates ran from 21.7% in Cape Coral to 24.6% in Fort Myers. Across the five featured cities, approximately one in five to one in four active listings had an expired, withdrawn, or terminated listing during the trailing 12 months. June and July both match against those three record types, so this is the first clean month-over-month read. Four of the five cities eased slightly from June, while Estero rose 1.5 points to 22.4%, the only market where the relist share grew.
Among homes that closed in the last 120 days, 16.1% had relisted before finding a buyer. The median relisted home sold for $50,050 below its earlier asking price, after a combined 235 days on the market across both attempts. First-attempt homes sold in a median of 58 days at $450,000. By city, that per-home dollar difference ran from $35,000 in Cape Coral to $73,430 in Naples.
For Southwest Florida sellers
Curious what your Southwest Florida home would bring in today’s market?
Get a Worthington pricing analysis built from the same MLS data behind this report.
Cape Coral and Naples Gained on Price, Fort Myers and Bonita Springs Slipped
Median sale price and price per square foot measure different things. Median sale price moves when the mix of homes closing changes, with more luxury closings pushing it up and more entry-level closings pushing it down, even when underlying values hold steady. Price per square foot controls for home size, which makes it a steadier read on values than the median alone, though it still moves with property type, location, condition, and sales mix. The two are best read together.
Regional median sale price rose 1.3% year over year to $395,000 while price per square foot eased 0.4% to $231. The two measures diverged much more sharply at the city level. Cape Coral rose on both, median up 12.3% and price per square foot up 3.7%, and Naples did the same, up 4.2% and 5.0%. Fort Myers and Bonita Springs softened. Fort Myers price per square foot fell 2.5% year over year to $199. That figure rebounded from June’s $193, the lowest point in 30 months, and marked the first monthly gain since April. One month up does not confirm a turn, and it is the first gain after a long stretch of year-over-year declines.
Recent Price Paths Differed Across the Five Cities
Recent price paths have differed by city. Regional supply peaked in early 2025, but the city-level price figures have not followed one uniform pattern since then. Naples price per square foot was about 5% above its July 2025 reading, while Cape Coral was roughly 7% above its March 2026 reading. Fort Myers rose from $193 in June to $199 in July but stayed 2.5% below a year ago. One month of improvement does not establish that a market has bottomed.
Rolling Figures Reduce Single-Month Volatility in Estero and Bonita Springs
Estero and Bonita Springs both run lower monthly transaction volumes, so Worthington reads their prices on a three-month rolling basis. Estero’s single-month median jumped 11.1%. Its steadier rolling median rose just 1.6% to $510,000, and rolling price per square foot fell 3.1% to $253, so the single-month figure appears heavily influenced by the month’s closing mix. Bonita Springs’ single-month median fell 6.0% and price per square foot fell 11.9%. On the steadier rolling series, the median eased 1.6% to $540,000 and price per square foot eased 4.5% to $299. Together, the rolling figures show milder median-price movement than the single-month results, while price per square foot declined in both cities.
Homes Are Selling Near Ask, While Luxury Asking Prices Stay High
The sale-to-list ratio compares what homes sold for to what they were asking at the time of contract. Worthington uses the most recent list price at time of contract, not the original asking price, so this figure does not capture the full distance from a seller’s first expectation to the final sale. The Ask-Bid Gap measures something different: how current active asking price per square foot compares with recent sold price per square foot across the market.
The regional sale-to-list ratio held at 96.5% in July, essentially unchanged from a year ago, so negotiating conditions at the point of contract have held steady. That figure compares the sale price with the final asking price at the time of contract, so it can reflect price changes made before the home went pending. The relist analysis adds context: relisted homes recorded substantially longer combined market time and sold a median $50,050 below their matched earlier asking price.
The Ask-Bid Gap, which compares current active asking price per square foot against trailing 120-day sold price per square foot as a percentage of recent sold prices, gives the market-wide pricing read. Bonita Springs carried the widest Ask-Bid Gap among the five featured cities at 14.5%, and its luxury listings above $1.5 million asked 39.8% more per square foot than recent luxury sales, the widest single tier this month. Naples sat at 7.9% overall and 17.5% in its luxury tier. Estero was the tightest at 2.8%, and its $750,000 to $1.5 million range ran negative at -2.2%, meaning asking prices there sit slightly below where recent sales have landed.
Shadow Inventory as of August 3
Some homes leave the market without selling and may return later, so Worthington tracks them as a supply signal. In this report, shadow inventory consists of properties that left the market through expiration, withdrawal, or termination and had not returned to active, pending, or closed status. Across the five featured cities, 1,764 addresses expired, withdrew, or terminated during July, and 172 of them, about 9.8%, had returned to active status, gone pending, or sold by the August 3 pull. The remaining 1,592 had not reappeared in one of those statuses. That is below June’s 30-day total of 1,811 that had not returned, so this shadow supply is not building.
Insurance Conditions to Verify Before Offering
Florida’s homeowners insurance market has been recovering, with average requested rate increases easing from roughly 22% two years earlier to under 1% in the latest 2026 filing data, though coastal and waterfront properties can still see steeper renewals. That easing has removed some of the friction insurance created at the height of the crisis, and buyers should still confirm coverage costs before writing an offer rather than at closing, particularly for older or waterfront homes.
Worthington Market Lens
The Worthington Market Lens compares the five featured cities using the same address-level measures. Lower Competitive Inventory means fewer current listings meet the competitive criteria. A smaller Ask-Bid Gap means asking prices are closer to recent sales. A higher Re-list Rate means more current listings have already been through an earlier listing attempt. A higher Pending-to-Active Ratio means more homes are under contract relative to the number for sale.
| City | Competitive Inventory (Months) | Re-list Rate | Ask-Bid Gap (Price/SF) | Pending-to-Active Ratio | Median Days to Contract, First Attempt | Median Total Days, Relisted |
|---|---|---|---|---|---|---|
| Fort Myers | 2.1 | 24.6% | 5.4% | 22.6% | 59 | 234 |
| Cape Coral | 2.1 | 21.7% | 6.6% | 28.4% | 47 | 208 |
| Estero | 1.5 | 22.4% | 2.8% | 26.4% | 58 | 253 |
| Bonita Springs | 1.7 | 23.8% | 14.5% | 20.7% | 66 | 253 |
| Naples | 1.8 | 23.1% | 7.9% | 21.2% | 65 | 242 |
Swipe to view all columns →
Source: FGCMLS. Full definitions for each metric are in Worthington’s market methodology. Worthington’s address-level metrics come from a property-level MLS export, a separate dataset from the published monthly counts used for the overall figures, so the active total can differ slightly. Ask-Bid Gap is expressed as a percentage of recent sold price per square foot.
City Snapshots
Fort Myers Market July 2026
- Active Listings
- 2,533 (-22.9% YoY)
- Sold (Last 120 Days)
- 2,152
- Months of Supply
- 5.4 overall / 2.1 Competitive Inventory
- Median Sold Price
- $331,000 (-1.2% YoY)
- Sellers Received
- 95.7% of final list price
- Re-list Rate
- 24.6%down 1.2 pts MoM
- Pending-to-Active Ratio
- 22.6%
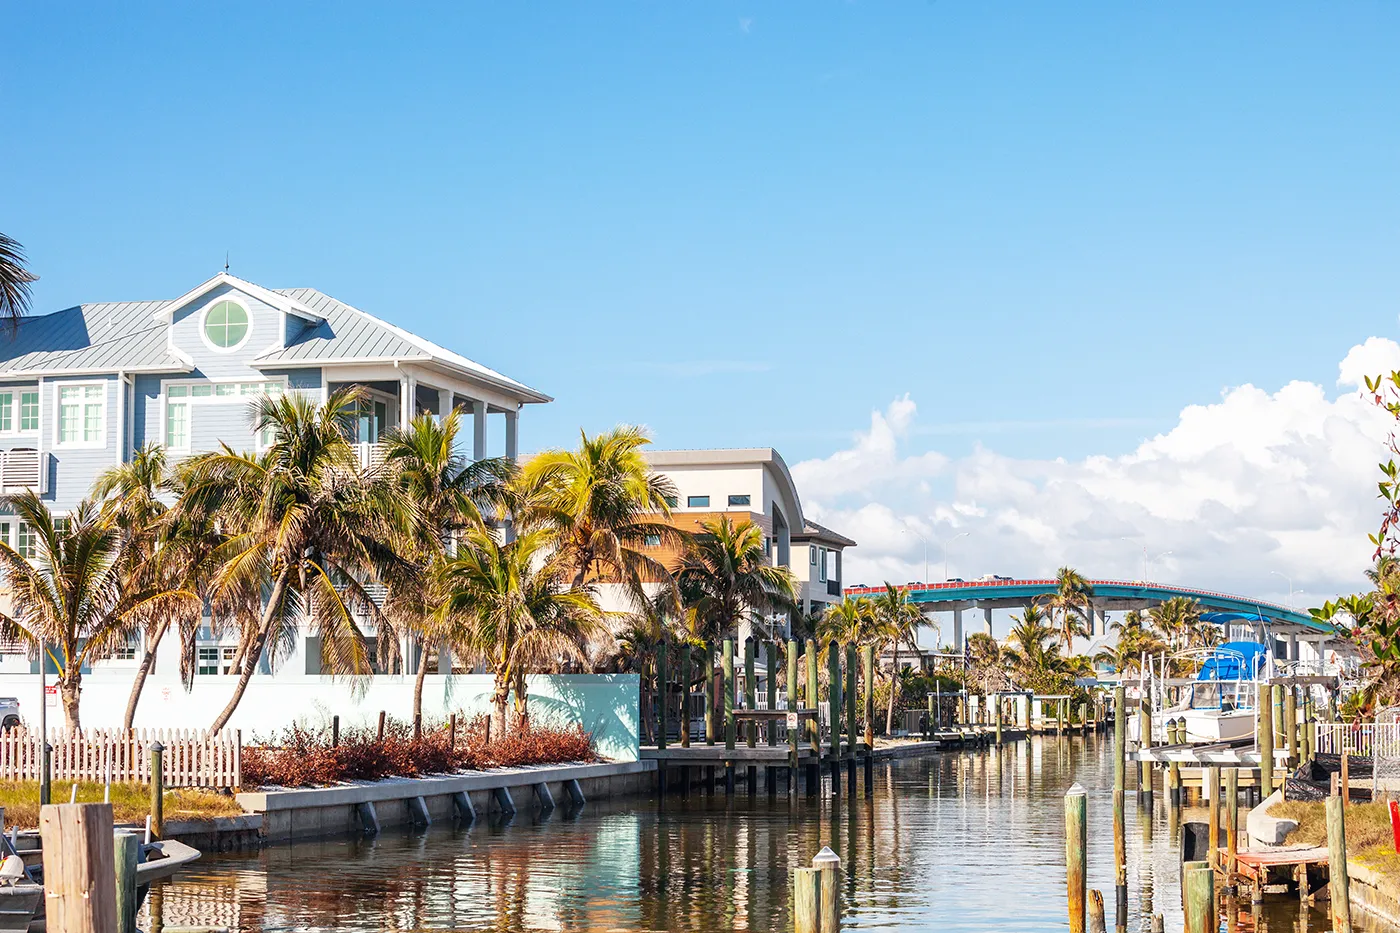
Fort Myers carried the highest Re-list Rate among the five featured cities at 24.6%. Its price per square foot rebounded to $199 after touching a 30-month low of $193 in June. That rebound is the first monthly gain since April and a data point worth watching, not yet a confirmed turn, since the figure remained 2.5% below a year ago. Closings came in essentially flat at 418.
Read the full Fort Myers market report. · Search Fort Myers homes for sale.

Cape Coral Market July 2026
- Active Listings
- 2,486 (-27.9% YoY)
- Sold (Last 120 Days)
- 2,286
- Months of Supply
- 4.9 overall / 2.1 Competitive Inventory
- Median Sold Price
- $393,000 (+12.3% YoY)
- Sellers Received
- 97.9% of final list price
- Re-list Rate
- 21.7%down 0.7 pts MoM
- Pending-to-Active Ratio
- 28.4%
Cape Coral’s median sale price rose 12.3%, while price per square foot rose 3.7%. Because both measures increased, the result was broader than the median change alone. Both measures can still be influenced by the mix of homes sold. Sellers received 97.9% of last list price, the closest to asking of any city among the five featured cities. Pending activity ran the highest relative to recent closings.
Read the full Cape Coral market report. · Search Cape Coral homes for sale.

Estero Market July 2026
- Active Listings
- 471 (-29.1% YoY)
- Sold (Last 120 Days)
- 597
- Months of Supply
- 3.8 overall / 1.5 Competitive Inventory
- Median Sold Price
- $507,500 single-month (+11.1% YoY), $510,000 three-month rolling (+1.6%)
- Sellers Received
- 96.7% of final list price
- Re-list Rate
- 22.4%up 1.5 pts MoM
- Pending-to-Active Ratio
- 26.4%
Estero held the tightest supply among the five featured cities at 3.8 months overall and 1.5 months of Competitive Inventory, even as its pending sales fell 21.8% year over year. Its single-month median rose 11.1%, while the three-month rolling median rose just 1.6% and rolling price per square foot fell 3.1%, so the low-volume month overstates the broader trend. Its pending pipeline cooled in July despite that limited supply.
Read the full Estero market report. · Search Estero homes for sale.
Bonita Springs Market July 2026
- Active Listings
- 743 (-33.2% YoY)
- Sold (Last 120 Days)
- 746
- Months of Supply
- 4.8 overall / 1.7 Competitive Inventory
- Median Sold Price
- $470,000 single-month (-6.0% YoY), $540,000 three-month rolling (-1.6%)
- Sellers Received
- 96.0% of final list price
- Re-list Rate
- 23.8%down 0.5 pts MoM
- Pending-to-Active Ratio
- 20.7%
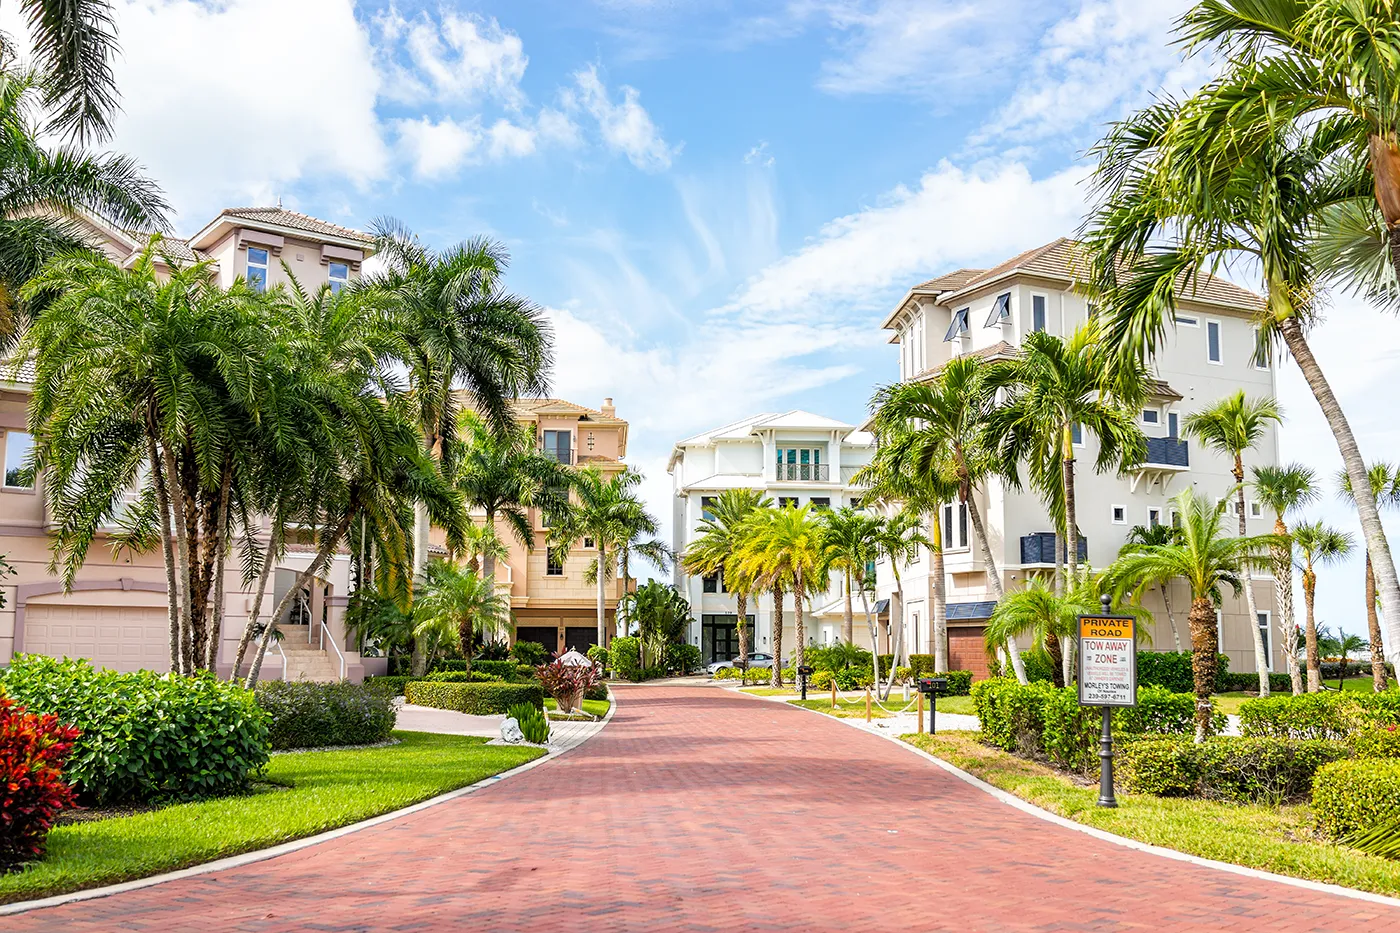
Bonita Springs carried the widest Ask-Bid Gap among the five featured cities at 14.5%, and its luxury tier above $1.5 million asked 39.8% more per square foot than recent luxury sales. On the three-month rolling series, the median eased to $540,000 and price per square foot to $299, a milder decline than the single-month readings. The difference between the single-month and rolling figures indicates that July’s closing mix amplified the monthly declines. Its Pending-to-Active Ratio of 20.7% was the lowest of the five.
Read the full Bonita Springs market report. · Search Bonita Springs homes for sale.
Naples Market July 2026
- Active Listings
- 4,138 (-22.9% YoY)
- Sold (Last 120 Days)
- 3,539
- Months of Supply
- 5.5 overall / 1.8 Competitive Inventory
- Median Sold Price
- $615,000 (+4.2% YoY)
- Sellers Received
- 95.0% of final list price
- Re-list Rate
- 23.1%down 0.3 pts MoM
- Pending-to-Active Ratio
- 21.2%
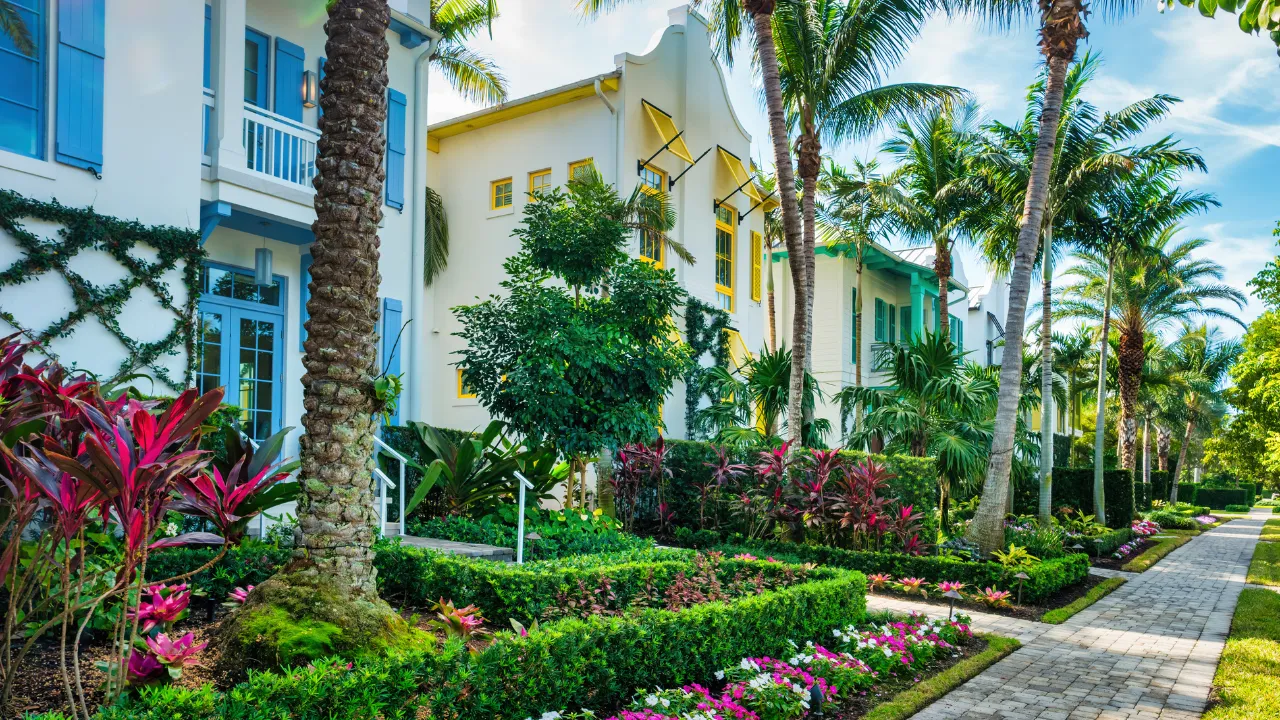
Naples posted the strongest price per square foot gain among the five featured cities, up 5.0% year over year to $337, with median sale price up 4.2%. On currently reported figures, its closings rose 9.0%, extending its year-over-year closing-growth streak to 14 months, subject to late MLS reporting. The luxury tier above $1.5 million carried a 17.5% Ask-Bid Gap and holds the largest pool of high-end listings among the five featured cities, so that is where sellers have the most reason to price against recent sales.
Read the full Naples market report. · Search Naples homes for sale.
For Southwest Florida buyers
See what’s for sale in Southwest Florida right now.
Create a free account to save searches and get alerts the moment new homes hit the market.
Frequently Asked Questions
Are Southwest Florida home prices up or down right now?
It depends on the measure and the city. The regional median rose 1.3% year over year while price per square foot eased 0.4%. Cape Coral and Naples rose on both, Fort Myers and Bonita Springs softened, and Estero looked strong on its single-month median but flat to lower on its steadier rolling figures.
How long does it take to sell a home in Southwest Florida?
First-attempt listings that sold in the last 120 days did so in a median of 58 days. Homes that relisted before selling took a median of 235 combined days, roughly four times as long.
What does months of supply mean for buyers and sellers?
It estimates how many months current inventory would last at the current pace with no new listings. Months of supply fell to 5.6 regionally, down from 8.5 a year ago. Competitive Inventory runs tighter, from 1.5 to 2.1 months across the five cities.
Is this a buyer’s market or a seller’s market in Southwest Florida?
Neither uniformly. Competitive Inventory is below 2.5 months in all five featured cities, so relatively few current listings meet the Competitive Inventory criteria. Relisted homes showed substantially longer combined market time and a median $50,050 difference from their matched earlier asking price. Wider Ask-Bid Gaps identify the price ranges where median active asking price per square foot sits furthest above recent sales. Property-level comparable sales and listing history are still needed before drawing a conclusion about a specific home.
Should I wait or act now in Southwest Florida?
There is no single answer for every buyer or seller. It depends on the city, price range, financing, property condition, and how a specific asking price compares with recent sales. Shrinking inventory reduces selection and can raise competition for well-priced homes, while wider Ask-Bid Gaps in the upper tiers give room to evaluate listings above recent levels. Pricing against current comparable sales may reduce the risk of extended exposure and a later relisting attempt.
The Bottom Line for Southwest Florida
Whether you are deciding when to list, how to price, or when to buy, July’s results in Southwest Florida ran in different directions. Cape Coral and Naples gained on both price measures, Fort Myers and Bonita Springs stayed below last year, and Estero’s monthly and rolling figures differed. Inventory and months of supply fell across the region. First-attempt homes sold in far less time than relisted ones, and relisted homes closed a median $50,050 below their earlier asking price. Worthington Realty helps homeowners across Fort Myers, Cape Coral, Estero, Bonita Springs, and Naples make sense of exactly this kind of market. Most homeowners feel overwhelmed when it’s time to move. At Worthington Realty, we provide personalized guidance and clear communication so that you feel heard, valued, and confident in your decisions.
What’s Your Home Worth?
Get a Worthington pricing analysis built from the same MLS data behind this report.
Create Your Free Account
Save searches and get alerts the moment new homes hit the market across Southwest Florida.
