


Estero’s pending sales fell 21.8% in July, yet its 3.8 months of supply stayed the tightest of the five cities.
Price / Sq Ft
$245
Median Sold Price
$507,500
Active Listings
471
Months of Supply
3.8
Estero recorded fewer pending and closed sales than a year ago, while months of supply remained the lowest among the five featured cities. New pending contracts and closings were both lower on a small monthly base, while inventory remained low relative to Estero’s recent sales pace. For the regional picture and how Estero compares with the other four cities, see the Southwest Florida market report. Property-level figures reflect the August 3 data pull, while published inventory and months of supply reflect the July month-end reporting period, and figures may update as late transactions are recorded.
Key Takeaways
- Published pending sales fell 21.8% year over year to 86, and closings were 95, down 9.5% on currently reported figures, both on Estero’s smaller monthly transaction base.
- Months of supply eased to 3.8, the tightest overall reading among the five featured cities, and Competitive Inventory was 1.5 months, also the tightest of the five.
- On the three-month rolling series, the median was $510,000, up 1.6% year over year, while price per square foot was $253, down 3.1%. The difference from the single-month median’s 11.1% increase indicates that July’s closing mix likely influenced the monthly result.
- Estero’s Re-list Rate was 22.4%, up 1.5 points from June, the only featured city where the relist share rose.
- In the $750,000 to $1.5 million range, active asking price per square foot sat 2.2% below recent sales, a negative Ask-Bid Gap that has narrowed from earlier this year.
New Listings, Active Supply, and What Is Coming to Market
Closed sales count transactions completed during July. The published pending-sales figure measures July contract activity, while Worthington’s property export provides a separate snapshot of homes still pending as of the August 3 pull.
New listings came in at 115 in July, down 19.6% from a year ago. Active inventory fell to 471, down from 664 a year ago, a 29.1% drop. Months of supply came in at 3.8, using the standard 12-month sales pace, the tightest overall reading among the five featured cities. The active count has declined for more than a year as homes sold or left the market through other listing exits while new supply did not fully replace them.
Published pending sales fell 21.8% year over year to 86, fewer new July contracts than a year ago on Estero’s small monthly base. Worthington’s August 3 address-matched export contained 125 pending homes against 473 active listings. That produced a Pending-to-Active Ratio of 26.4%, or about 26 pending homes for every 100 active listings, and equaled 96.2% of the recent three-month closing pace. Showings per listing rose to 3.9 from 2.5 a year ago. Closings came in at 95, down 9.5% against last July on currently reported figures. Both the pending and closing figures sit on a low monthly base, where a small number of transactions moves the percentage, and the closing count remains preliminary and may update as late transactions are recorded.
Estimated Payment at the July 30 Mortgage Rate
The 30-year fixed-rate mortgage averaged 6.66% for the week of July 30, 2026, per Freddie Mac’s Primary Mortgage Market Survey. At Estero’s $507,500 median price, a buyer putting 20% down and financing $406,000 would carry a principal-and-interest payment of about $2,609 a month. Estimated principal and interest only, based on 20% down at a 30-year fixed rate of 6.66%. Property taxes, homeowners and flood insurance, HOA dues, closing costs, and other expenses are not included. Actual rates and payments vary.
Estero’s Single-Month and Rolling Price Measures Differed in July
Median sale price and price per square foot measure different things, and the distinction matters more in Estero. Because Estero’s monthly transaction volume runs lower than Fort Myers, Cape Coral, or Naples, single-month medians here carry more variance, which is why Worthington also tracks a three-month rolling figure for this market.
The figures in the regional table above are single-month readings. On that basis, Estero’s median was $507,500 in July, up 11.1% year over year, and price per square foot was $245, down 0.4%. The three-month rolling series showed smaller price changes. Rolling median was $510,000, up 1.6% year over year, and rolling price per square foot was $253, down 3.1%. The difference between the 11.1% single-month increase and the 1.6% rolling increase indicates that July’s closing mix likely influenced the monthly result. Dollar volume was $50.2 million, down 14.3% year over year on the lower closing count. Homes sold for a median 96.7% of their most recent asking price, the sold-to-list ratio, up from a year ago.
Relisted Estero Homes Took Longer and Sold Below Earlier Asking Prices
Worthington’s Re-list Rate shows how much of today’s active inventory has already been through an earlier listing attempt. One mechanical detail matters here: when a home relists, its days-on-market counter resets to zero, so a listing showing 15 days may have spent 200 or more days on the market during an earlier attempt. This section’s active-listing count comes from Worthington’s address-matched property export, which can differ slightly from the published monthly figures above.
Of Estero’s 473 active listings, 106 (22.4%) had an expired, withdrawn, or terminated listing in the past 12 months, up 1.5 points from June, the only featured city where the share rose this month. Of those relists, 50.0% returned at least 3% below their earlier asking price. Among homes that closed in the last 120 days after relisting, the median earlier asking price was $599,999 and the median final sale price was $546,500, a $50,000 difference calculated per home. Those relisted homes carried a median 253.5 combined days on the market across both attempts, compared with 57.5 days for first-attempt homes that sold at a median of $520,000. A home’s full listing history is worth reviewing when judging its price and how long it has really been for sale.
For Estero sellers
Curious what your Estero home would bring in today’s market?
Get a Worthington pricing analysis built from the same MLS data behind this report.
Estero Competitive Inventory Measured 1.5 Months
Several supply numbers appear in this report, and they answer different questions rather than contradicting each other. Published months of supply is 3.8 on the standard 12-month pace. Competitive Inventory uses the more recent three-month pace and counts only active listings under 90 days on market that are either first-attempt listings or relists that returned at least 3% below their earlier asking price. Older listings and relists that returned without at least a 3% price reset are excluded.
Competitive Inventory Runs Far Below Estero’s Overall Supply
On that three-month pace, the all-listings figure is 3.6 months. Removing long-stale listings leaves 2.9 months. Applying the full Competitive Inventory filter brings it to 1.5 months, the tightest reading among the five featured cities. That 1.5-month reading means relatively few current listings meet the Competitive Inventory criteria. It is lower than the all-listings figure because older listings and relists without the required price reset are excluded. Older and previously listed inventory should be evaluated separately, especially where asking prices remain above recent sales. Fresh, first-attempt listings that sold did so in a median of 57.5 days.
Estero’s $750K to $1.5M Range Ran Below Recent Sales
The Ask-Bid Gap compares current active asking price per square foot with recent sold price per square foot, as a percentage of recent sales. Estero sits at 2.8% overall, the tightest among the five featured cities. That overall figure masks an important difference by price tier. Listings below $400,000 ran a 2.0% Ask-Bid Gap and the $400,000 to $750,000 tier ran 1.9%, both closely aligned with recent sales, while the luxury tier above $1.5 million ran 21.1%.
The $750,000 to $1.5 million tier ran -2.2%, meaning active asking price per square foot in that range sat below recent sold price per square foot. That negative reading has narrowed from earlier in the year, and it is worth checking against property-level comparable sales, since the active and closed pools in that range can differ by community, product type, and whether the home is new construction or resale.
Florida’s homeowners insurance market has been recovering, with average requested rate increases easing from roughly 22% two years earlier to under 1% in the latest 2026 filing data. Insurance costs can vary considerably with replacement cost, construction, roof age, wind mitigation, and flood exposure. Buyers should confirm coverage costs before writing an offer.
Regional Snapshot at a Glance
| City | Median Sold Price | Median YoY | Price/SF | Price/SF YoY | Active Listings | Active YoY | Months Supply | Months Supply YoY | Sold-to-List | Closed Sales | Closed YoY |
|---|---|---|---|---|---|---|---|---|---|---|---|
| Fort Myers | $331,000 | -1.2% | $199 | -2.5% | 2,533 | -22.9% | 5.4 | -32.5% | 95.7% | 418 | -0.2% |
| Cape Coral | $393,000 | +12.3% | $222 | +3.7% | 2,486 | -27.9% | 4.9 | -37.2% | 97.9% | 520 | +7.7% |
| Estero | $507,500 | +11.1% | $245 | -0.4% | 471 | -29.1% | 3.8 | -40.6% | 96.7% | 95 | -9.5% |
| Bonita Springs | $470,000 | -6.0% | $274 | -11.9% | 743 | -33.2% | 4.8 | -45.5% | 96.0% | 115 | -1.7% |
| Naples | $615,000 | +4.2% | $337 | +5.0% | 4,138 | -22.9% | 5.5 | -36.8% | 95.0% | 664 | +9.0% |
| Southwest Florida | $395,000 | +1.3% | $231 | -0.4% | 15,456 | -22.9% | 5.6 | -34.1% | 96.5% | 2,580 | +5.4% |
Swipe to view all columns →
Source: FGCMLS. Single-month data unless otherwise noted. Sold-to-list uses most recent list price at time of contract.
Worthington Market Lens
The Worthington Market Lens compares the five featured cities using the same address-level measures. Lower Competitive Inventory means fewer current listings meet the competitive criteria. A smaller Ask-Bid Gap means asking prices are closer to recent sales. A higher Re-list Rate means more current listings have already been through an earlier listing attempt. A higher Pending-to-Active Ratio means more homes are under contract relative to the number for sale.
| City | Competitive Inventory (Months) | Re-list Rate | Ask-Bid Gap (Price/SF) | Pending-to-Active Ratio | Median Days to Contract, First Attempt | Median Total Days, Relisted |
|---|---|---|---|---|---|---|
| Fort Myers | 2.1 | 24.6% | 5.4% | 22.6% | 59 | 234 |
| Cape Coral | 2.1 | 21.7% | 6.6% | 28.4% | 47 | 208 |
| Estero | 1.5 | 22.4% | 2.8% | 26.4% | 58 | 253 |
| Bonita Springs | 1.7 | 23.8% | 14.5% | 20.7% | 66 | 253 |
| Naples | 1.8 | 23.1% | 7.9% | 21.2% | 65 | 242 |
Swipe to view all columns →
Source: FGCMLS. Full definitions are in Worthington’s market methodology. Worthington’s address-level metrics come from a property-level MLS export, a separate dataset from the published monthly counts, so the active total can differ slightly. Ask-Bid Gap is expressed as a percentage of recent sold price per square foot.
Estero Featured Communities: 120-Day Sales and Current Inventory
Community figures use a 120-day window for enough transaction volume, so they are not on the same basis as the city’s 12-month months of supply. Re-list Rate here carries a month-over-month point change, since June and July both match against expired, withdrawn, and terminated records.
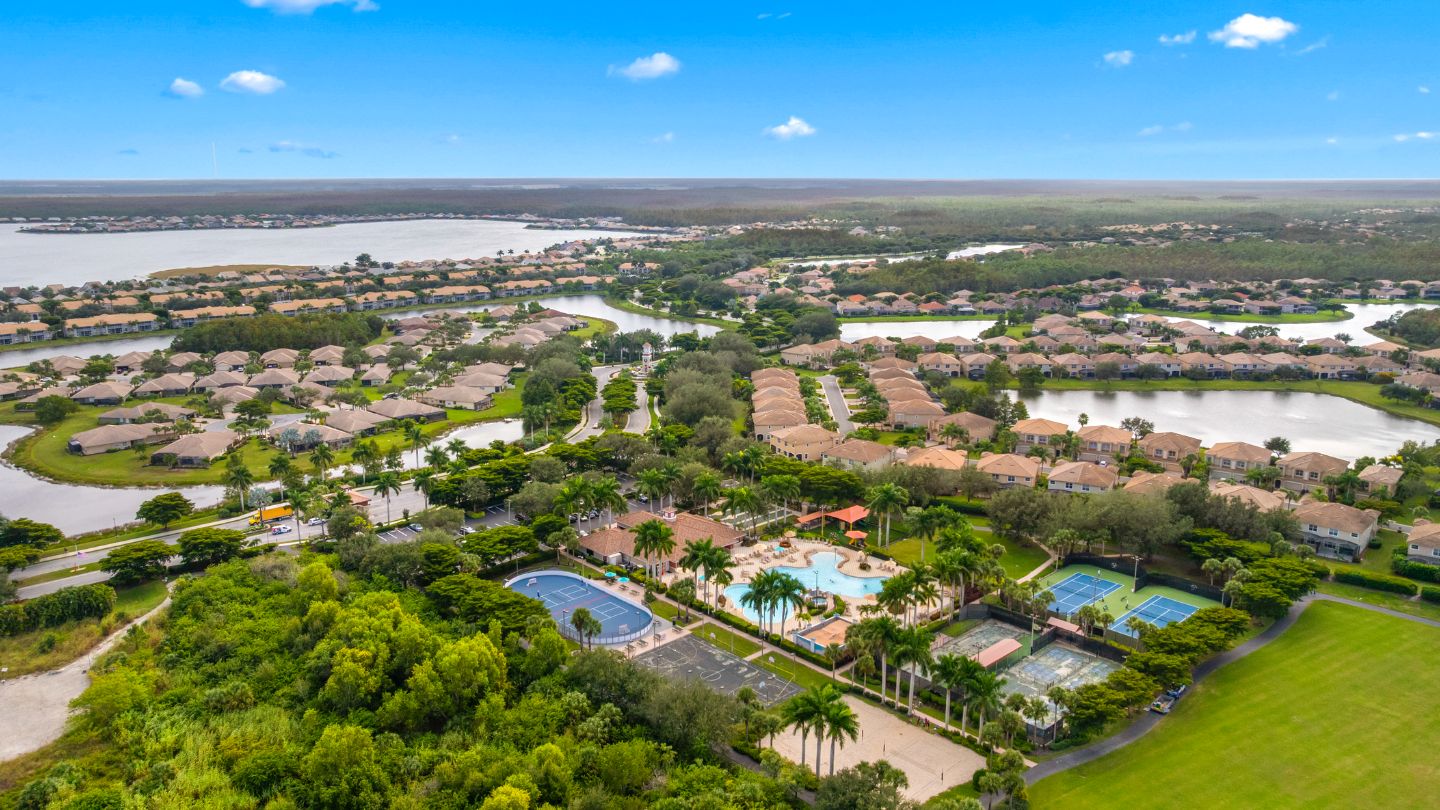
Bella Terra
Active listings fell 17.4% while closings rose 16.7%.
The community-wide $450,000 median moves with the closing mix, since the 120-day closed pool holds two groups, Bella Terra proper homes and villas at a higher median and Barletta condos at a lower one. Bella Terra is a Tuscan-themed, no-golf community on Corkscrew Road built by Lennar, spanning condominiums and villas to estate homes. Sellers should use Bella Terra proper comparables for homes and villas and Barletta comparables for condos.
View 5 more indicators
- Active Listings
- 19down 17.4% MoM
- Closings (Last 120 Days)
- 49up 16.7% MoM
- Pending Contracts
- 11down 35.3% MoM
- Re-list Rate
- 21.1%up 8.1 pts MoM
- Sellers Received (Median)
- 97.7% of final list priceup 0.1 pts MoM
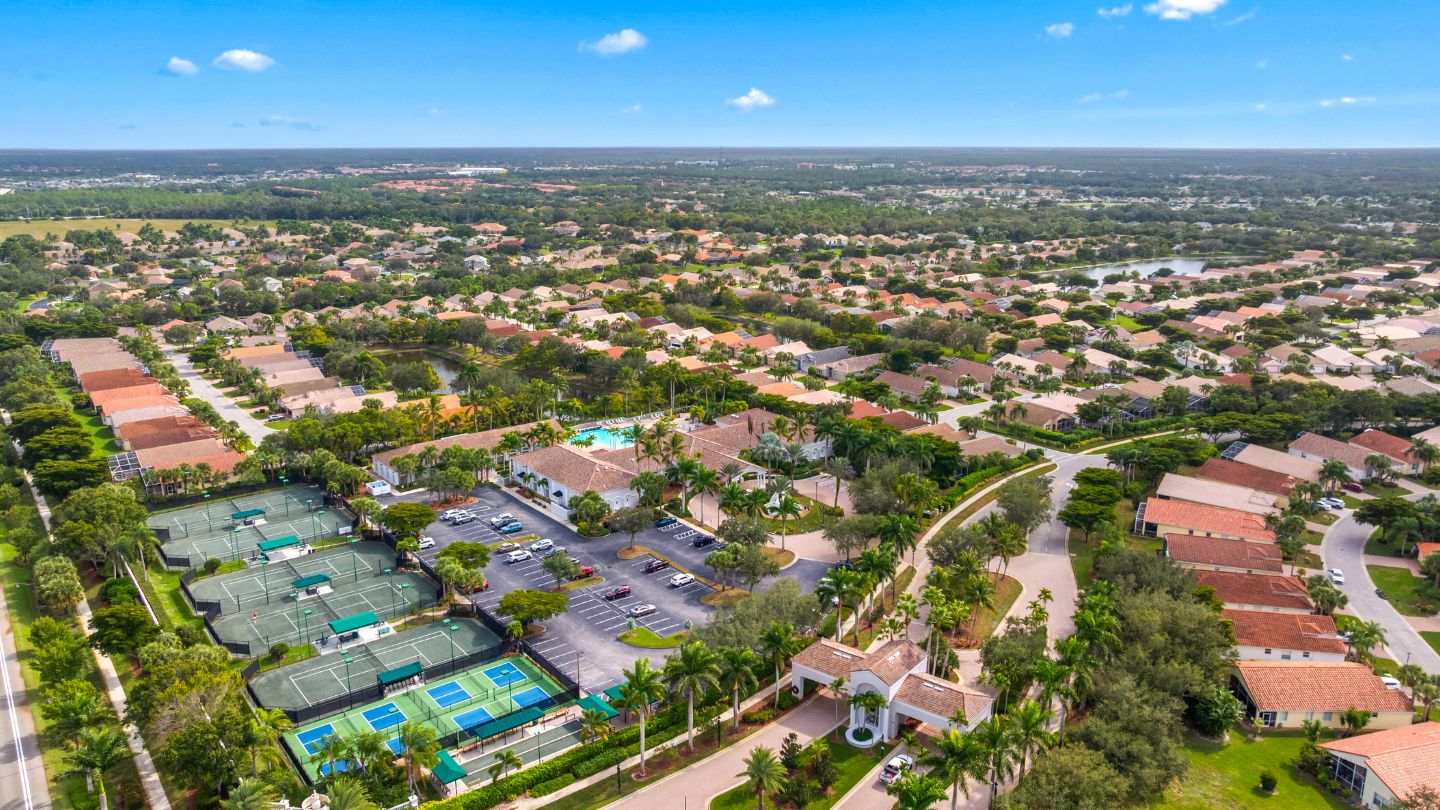
Cascades at Estero
Active listings fell 33.3% while pending contracts held at 4.
Selection is limited, with just 6 active listings against 4 pending contracts, and 13 closings over the past 120 days settled at a $417,500 median. Cascades at Estero is a gated 55-plus community by Levitt & Sons with 614 detached single-family homes and no golf. Because the closing sample is modest, a single transaction can move the community median, so treat it as a guide rather than a precise benchmark.
View 5 more indicators
- Active Listings
- 6down 33.3% MoM
- Closings (Last 120 Days)
- 13down 23.5% MoM
- Pending Contracts
- 4flat MoM
- Re-list Rate
- 16.7%down 16.6 pts MoM
- Sellers Received (Median)
- 95.2% of final list priceflat MoM
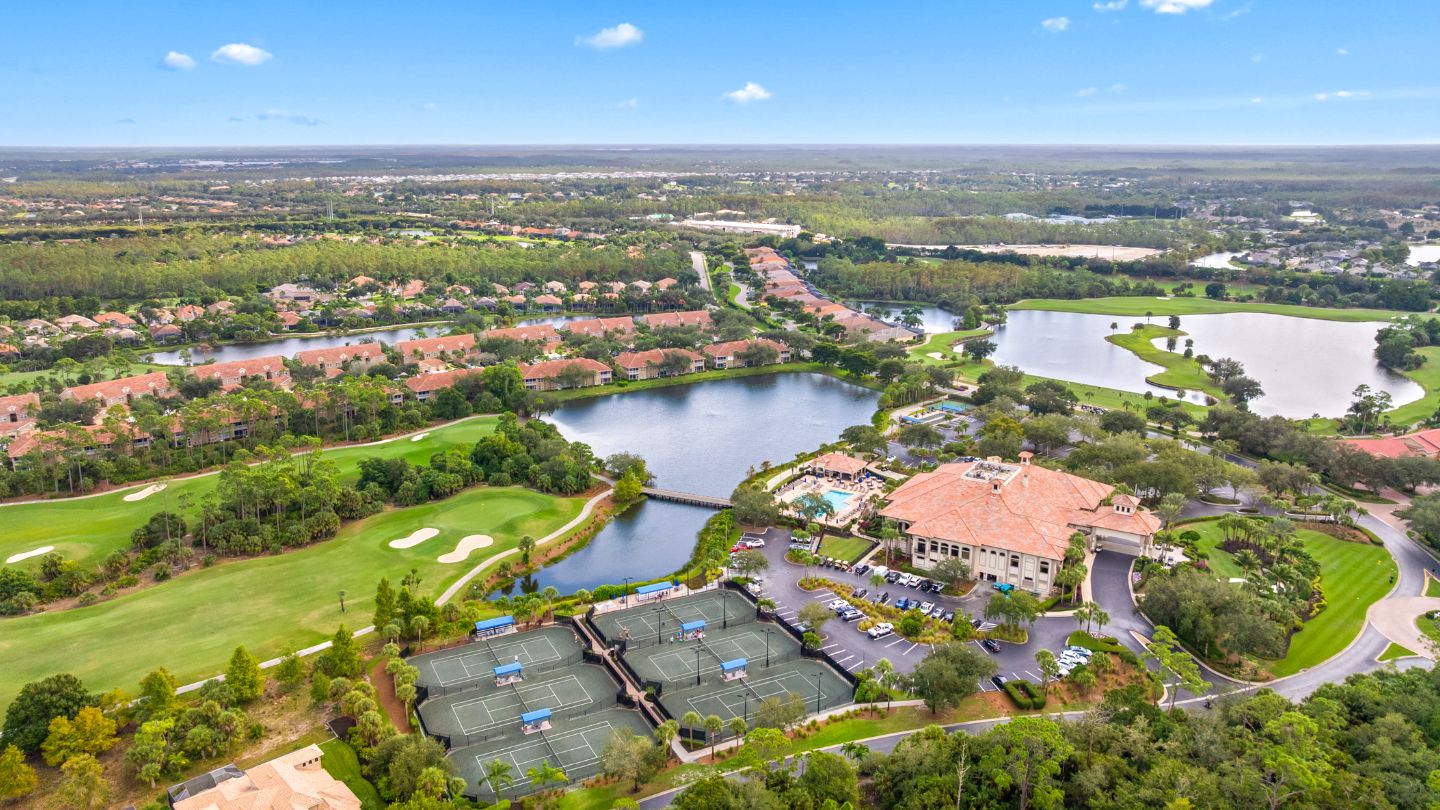
Grandezza
Pending contracts fell 40.0% and closings fell 19.2% over the month.
Recent closings ranged widely across Grandezza’s product types, putting the community median at $620,000, while the active pool leans toward coach homes at a lower asking median. Grandezza is an all-ages equity golf community by Stock Development spanning 11 sub-neighborhoods, from coach homes to custom estate lots. Sellers should base asking price on closings from the same sub-neighborhood and property type.
View 5 more indicators
- Active Listings
- 13down 13.3% MoM
- Closings (Last 120 Days)
- 21down 19.2% MoM
- Pending Contracts
- 3down 40.0% MoM
- Re-list Rate
- 30.8%up 4.1 pts MoM
- Sellers Received (Median)
- 95.2% of final list priceup 0.2 pts MoM
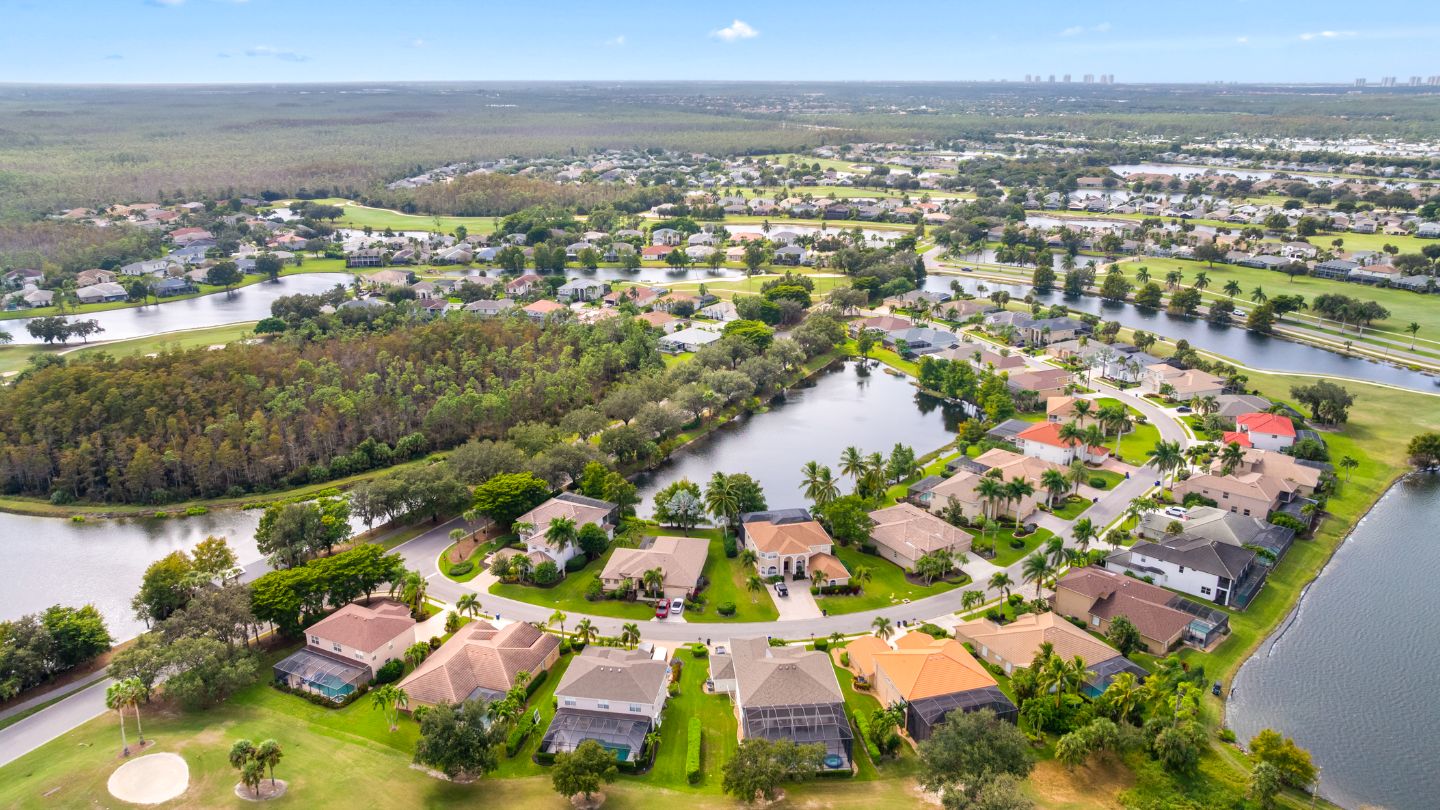
Stoneybrook
The median rose 14.0% while closings fell 28.6%.
The 120-day pool ranges from condos to single-family homes, and the $490,000 median rose this month on a heavier single-family share among recent closings. Stoneybrook is an all-ages gated community on Corkscrew Road with a public pay-per-play golf course and no mandatory fees, offering condos through single-family homes. With a closing sample this small, buyers should match comparable sales to the specific home type rather than lean on the community median.
View 5 more indicators
- Active Listings
- 10down 16.7% MoM
- Closings (Last 120 Days)
- 15down 28.6% MoM
- Pending Contracts
- 2flat MoM
- Re-list Rate
- 30.0%up 5.0 pts MoM
- Sellers Received (Median)
- 97.7% of final list priceup 0.7 pts MoM
Verdana Village
Closings rose 10.9% and active listings rose 3.0%.
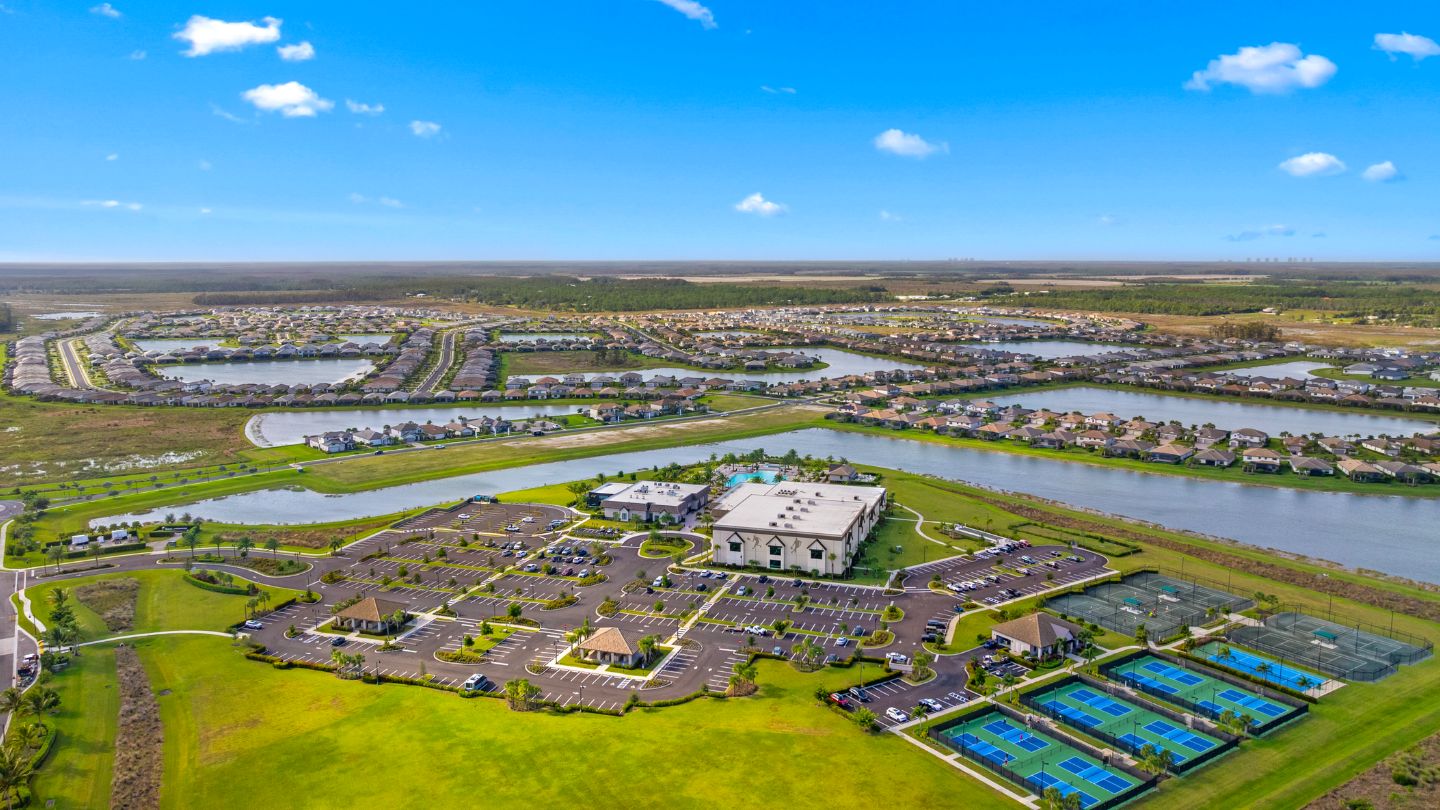
The active pool asks a higher median than the $617,000 closed median, a distance that traces to larger and newer homes listed, some of it builder inventory. Verdana Village is an all-ages resort community in east Estero developed by Cameratta with Lennar and Pulte, with new construction still being delivered. Resale sellers should price from recent resale closings rather than the active asking range, which leans toward larger new product.
View 5 more indicators
- Active Listings
- 34up 3.0% MoM
- Closings (Last 120 Days)
- 61up 10.9% MoM
- Pending Contracts
- 10down 9.1% MoM
- Re-list Rate
- 20.6%up 2.4 pts MoM
- Sellers Received (Median)
- 98.4% of final list priceup 1.1 pts MoM
The Place at Corkscrew
Active listings rose 12.5% while the median fell 8.5%.
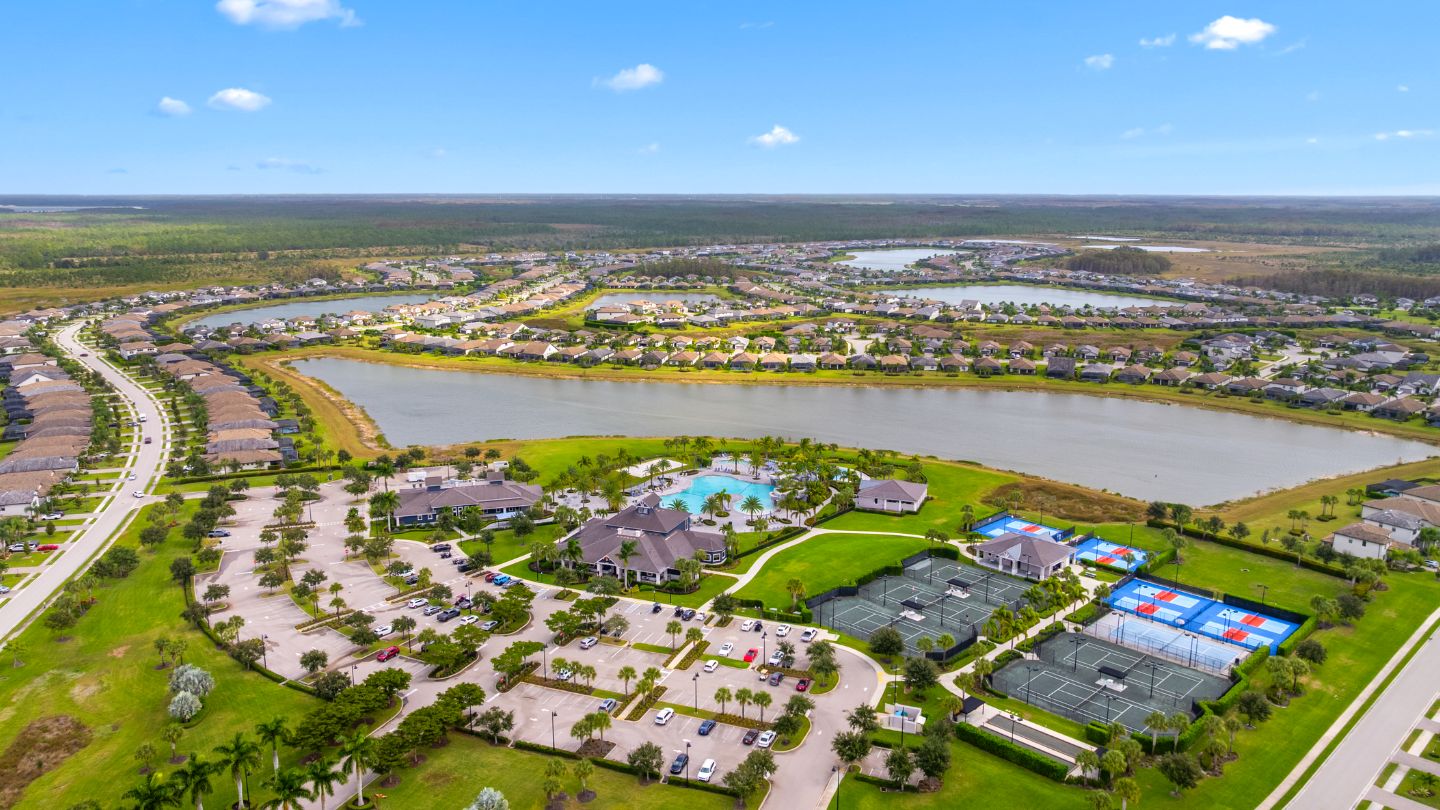
The Place at Corkscrew closed 45 homes over the past 120 days at a $700,000 median, down from the prior reading as the closing mix changed, while the active asking median sits close to that figure. An all-ages resort community in east Estero by Cameratta with Pulte and Lennar, it offers single-family homes and villas around a resort amenity center. With 1.6 months of inventory, sellers should price from recent comparable closings within their product type.
View 5 more indicators
- Active Listings
- 18up 12.5% MoM
- Closings (Last 120 Days)
- 45down 8.2% MoM
- Pending Contracts
- 10down 16.7% MoM
- Re-list Rate
- 11.1%down 1.4 pts MoM
- Sellers Received (Median)
- 97.1% of final list pricedown 0.2 pts MoM
For Estero buyers
See what’s for sale in Estero right now.
Create a free account to save searches and get alerts the moment new homes hit the market.
Frequently Asked Questions
Is Estero a good place to buy right now?
It depends heavily on price range. In the $750,000 to $1.5 million range, active asking price per square foot sat 2.2% below recent sold price per square foot, a pattern worth testing against property-level comparable sales. Citywide, Estero has the tightest Competitive Inventory among the five featured cities at 1.5 months, so buyers should compare fresh, well-priced homes separately from older and previously listed inventory.
Why isn’t my Estero home selling?
Start by comparing the asking price, condition, property type, community, and whether the home is new construction or resale with the most relevant recent sales. Estero’s Re-list Rate rose to 22.4% this month, and relisted homes sold a median $50,000 below their earlier asking price. Anchoring the price to recent comparable sales early reduces the chance of a long stay on the market and a second listing.
How much below asking should I offer in Estero?
In the $750,000 to $1.5 million range, median active asking price per square foot sat 2.2% below the recent sold median. That tier-level comparison does not determine an offer on an individual property. The home’s community, condition, listing history, membership obligations, and closest comparable sales should guide the offer.
How long does it take to sell a home in Estero?
First-attempt listings that sold did so in a median of 57.5 days. Homes that relisted before selling took a median of 253.5 combined days.
How does Estero compare with the rest of Southwest Florida?
Estero holds the tightest overall months of supply and the tightest Competitive Inventory among the five featured cities, and the tightest overall Ask-Bid Gap. Its pending and closing counts fell year over year in July on a small monthly base, and its steadier rolling price figures are softer than the single-month median suggests.
The Bottom Line for Estero
Estero recorded fewer pending and closed sales in July, even as inventory remained low relative to its recent sales pace. Pending sales fell 21.8% year over year, while months of supply measured 3.8 overall and 1.5 under the Competitive Inventory criteria. The single-month median rose 11.1%. The rolling median increased 1.6%, while rolling price per square foot declined 3.1%. That difference indicates that July’s closing mix likely influenced the single-month result.
Buyers in the $750,000 to $1.5 million range should compare active asking prices closely with recent sold prices, where asking has run slightly below recent sales. Sellers elsewhere should use property- and tier-specific comparable sales, since the citywide Ask-Bid Gap masks wide variation by price range.
Most homeowners feel overwhelmed when it’s time to move. At Worthington Realty, we provide personalized guidance and clear communication so that you feel heard, valued, and confident in your decisions.
What’s Your Home Worth?
Get a Worthington pricing analysis built from the same MLS data behind this report.
Create Your Free Account
Save searches and get alerts the moment new homes hit the market across Southwest Florida.
