


This is a past report. It covers Cape Coral market data for February 2026. For current numbers, see our Cape Coral housing market page.
Inventory Dropped 26% and Competitive Supply Fell Below Four Months
In the year through February 2026, Cape Coral shed more inventory than any other Southwest Florida city, and buyers responded with the highest showing activity in the region. The competitive segment of the Cape Coral housing market was below four months of supply, though a gap between what sellers asked and what buyers paid persisted above $500,000, fueled partly by the largest new construction pipeline in the area. What follows is a breakdown of where that gap was, which price tiers were absorbing fastest, and what the community-level data said about timing a move. For regional comparisons, see the Southwest Florida housing market update.
Key Takeaways, February 2026 Data
- Cape Coral’s inventory fell 26.4% year over year, the steepest decline in Southwest Florida, while closed sales rose 16.0% to 427.
- Competitive months of supply sits at 3.8, second-tightest in the region behind Estero’s 3.6, meaning properly priced homes face far less competition than the 6.3-month overall figure suggests.
- New construction accounts for 34.4% of active inventory and carries lower relist rates than resale homes, a factor that distinguishes Cape Coral from its neighbors.
- Showings per listing increased 22.9% year over year to 4.3, the highest buyer engagement reading in the region.
- A 13.3% gap between what sellers are asking per square foot ($244) and what buyers are paying ($216) remains the widest in Lee County, concentrated in properties priced above $500,000.
The Cape Coral Housing Market Posted the Region’s Strongest Absorption Gains
February data confirms that Cape Coral is absorbing inventory faster than any other Southwest Florida market. Inventory dropped 26.4% while sales rose 16.0%. The result: months of supply fell from 9.2 to 6.3. Dollar volume surged 20.6% to $206 million.
Buyer Activity Is Accelerating
Pending contracts rose 5.6% to 605, and showings per listing climbed from 3.5 to 4.3 year over year. The pending-to-active ratio of 25.6% is the second highest in the region behind Estero. Median days on market actually fell 13.1% to 53, the only city where homes are selling faster than a year ago. Falling mortgage rates are part of that showing jump, though with nearly four in ten purchases across the region closing in cash, rates alone do not explain the activity gains.
Prices Are Adjusting Modestly
Median sale price settled at $375,000, down 3.2% from last February and recovering from a $350,000 trough in July 2025. Price per square foot fell 2.2% to $218, a moderate decline compared to Fort Myers (9.0%) or Estero (14.0%). The 13.3% gap between asking and sold price per square foot ($244 vs. $216) comes mostly from sellers above $500,000 who are listing higher than buyers are willing to go. It does not mean the whole market is soft.
One-Quarter of Cape Coral Listings Have Already Failed and Returned
Of 3,089 active listings, 836 (27.1%) previously failed within the past 12 months. That is actually the second-lowest relist rate among the five cities, behind only Estero at 26.8%.
Price Adjustments and Outcomes
Returning sellers reduced their price by a median of 4.8%, the smallest adjustment in the region. That signals some sellers are making only modest corrections rather than the 6% to 7% reductions seen in Fort Myers and Bonita Springs. The 342 relisted homes that eventually sold closed at a median of $435,000 against an original ask of $479,000, a $47,000 gap. Total marketing time across both attempts reached 220 days, compared to 59 days for first-attempt sales.
Where Pricing Misses Concentrate
The relist pattern in the Cape Coral housing market follows a clear price gradient. At the $250,000 to $500,000 level, the relist rate is 23.4%. It climbs to 30.4% for homes between $500,000 and $750,000, then reaches 35.5% above $2 million. The lower end of the market, where most new construction competes, shows healthier alignment between asking and selling prices.
New Construction Plays a Distinctive Role
Cape Coral’s 34.4% new construction share is more than double that of Fort Myers (7.8%) and Naples (14.2%). Newer homes carry a 23.0% relist rate compared to 29.2% for resale, and those that do relist adjust by a smaller amount. Builders appear to be pricing closer to what the market will bear, likely because they operate on volume models that penalize extended marketing times.
Where the Real Competition Lives
Overall months of supply for the Cape Coral housing market stands at 7.6. Remove stale inventory (180-plus days) and stubborn relists (homes that returned at the same or higher price), and the number drops to 5.4. Isolate the competitive market, listings under 90 days that are either first-attempts or relists with a meaningful price reduction, and it falls to 3.8 months, second-tightest competitive supply in the region behind Estero’s 3.6. Fresh first-attempt listings carry a median of 24 days on market. The gap between the overall supply number and the competitive figure is wide enough to change the strategic picture for a seller preparing to list.
Homes Move When Pricing Meets the Market in Cape Coral Featured Communities
Community-level data across Cape Coral shows wide variation in how quickly homes sell depending on how much is available and how many listings are returning from a prior attempt. What holds consistent is the pattern: homes that close are the ones where the asking price reflected what recent buyers have been willing to pay. Differences between established residential neighborhoods and waterfront-oriented communities continue to shape how quickly listings find a contract.
Cape Harbour
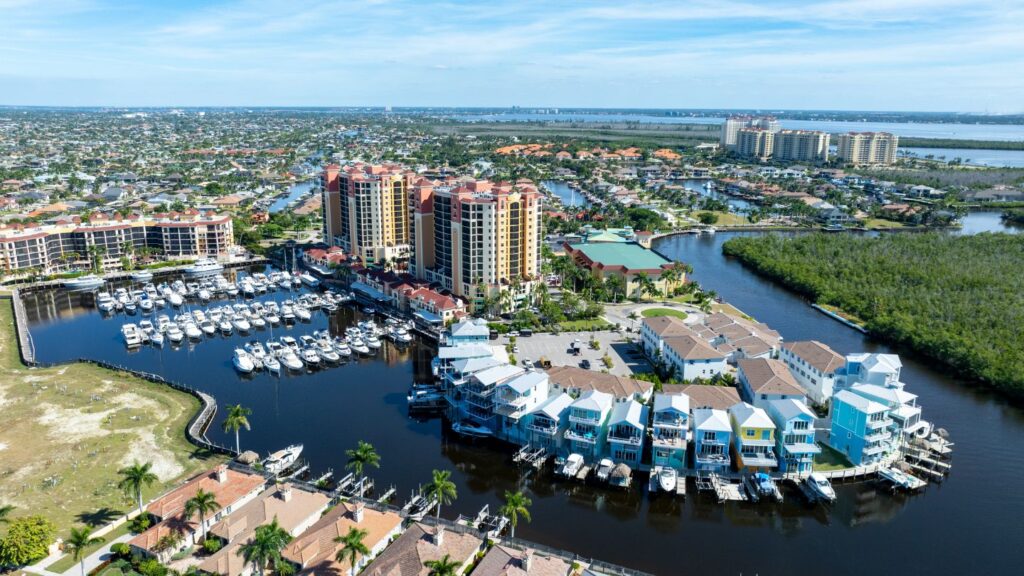
- Active Listings: 40
- Sold (Last 120 Days): 13
- Homes Pending: 5
- Previously Listed Share of Active: 32.5%
- Months of Inventory: 12.3
- Median Sold Price: $1,150,000
- Sellers Received: 92.2% of asking price
Cape Harbour has the most homes available relative to how many are selling among Cape Coral featured communities, with over 12 months of supply. Roughly one-third of active listings represent homes previously on the market, and those returning sellers adjusted by a median of nearly 9%. Recent closings span from the mid-$600s to over $3 million, so the sold median ($1,150,000) can move depending on which homes happen to close in a given month. Pending activity remains limited with 5 homes under contract, and the 92.2% sold-to-list ratio means buyers are negotiating with confidence. The relist share and sold-to-list ratio show that pricing accuracy determines outcome. For buyers, deep inventory and room to negotiate support being selective.
Search Cape Harbour homes for sale
Cape Royal
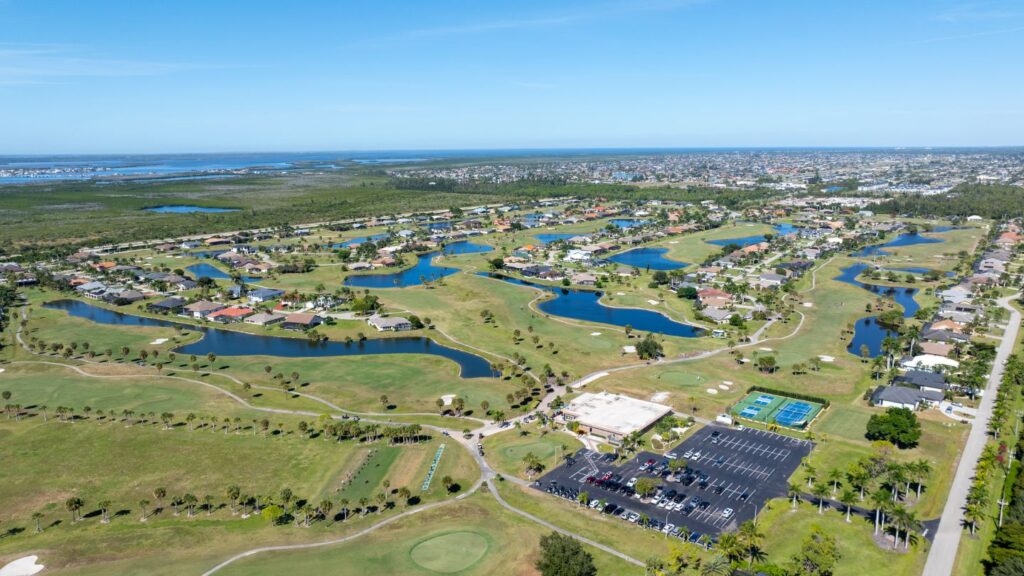
- Active Listings: 18
- Sold (Last 120 Days): 7
- Homes Pending: 3
- Previously Listed Share of Active: 33.3%
- Months of Inventory: 10.3
- Median Sold Price: $618,500
- Sellers Received: 94.7% of asking price
Cape Royal is a smaller community where one-third of active homes are second-attempt entries, with returning sellers reducing by a median of about 6%. Two distinct sections tell different stories: Cape Royal proper (12 listings, $974,050 median, 98 DOM) and Royal Tee Country Club Estates (6 listings, $669,000, 41 DOM). Royal Tee listings are finding buyers significantly faster. Pending homes carry a $630,000 median at 27 DOM, with deals forming in the more affordable price range. With only 7 sales over the past four months, any single closing can move the numbers, so this community reads more clearly over a longer window. For buyers, the pending data points toward opportunity at the lower price points.
Search Cape Royal homes for sale
Sandoval
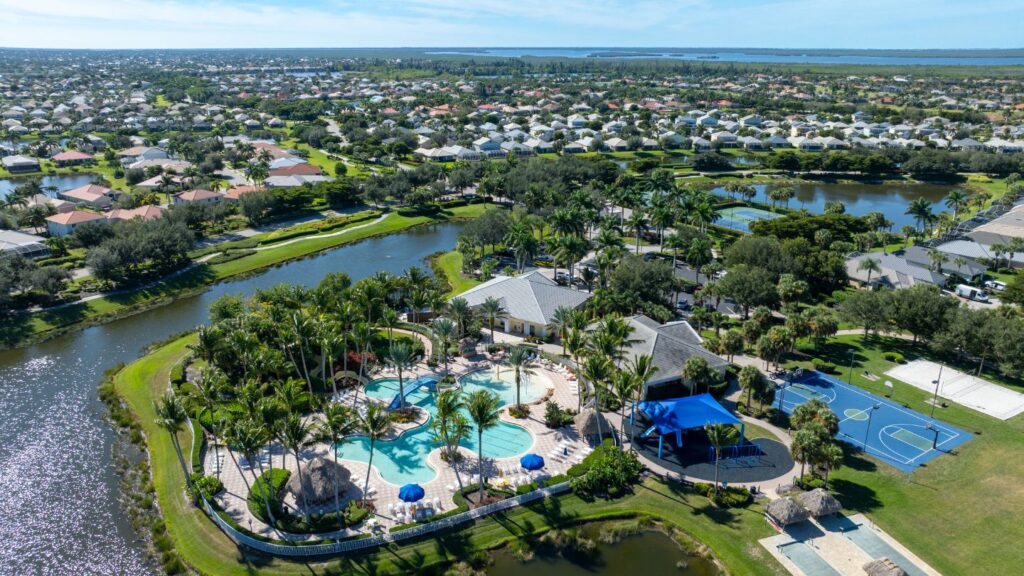
- Active Listings: 46
- Sold (Last 120 Days): 22
- Homes Pending: 14
- Previously Listed Share of Active: 21.7%
- Months of Inventory: 8.4
- Median Sold Price: $396,500
- Sellers Received: 94.9% of asking price
Sandoval shows the most balanced picture in the Cape Coral group. Recent sales and pending homes together account for a notable share of what is available, and the relist share (21.7%) is the lowest here. Returning sellers adjusted by a median of about 6%. The community ranges from 2-bedroom homes near $310,000 to 5-bedroom homes above $700,000, with 3-bedroom and 3+den sizes making up the bulk. About 43% of active listings have been on market less than 60 days, and fresh inventory continues to enter steadily. Pending homes carry a $367,450 median, sitting below the active median, so the next round of closings may come in lower. The relist share and pending activity place Sandoval near the midpoint of Cape Coral’s supply spectrum. The range of choices across price points supports taking time to find the right home.
Search Sandoval homes for sale
Tarpon Point
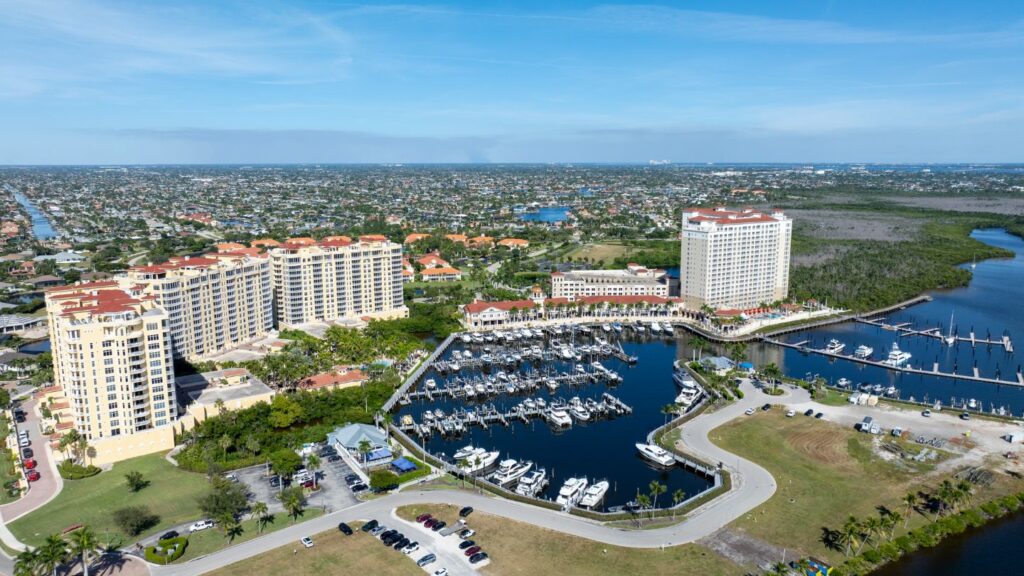
- Active Listings: 18
- Sold (Last 120 Days): 8
- Homes Pending: 4
- Previously Listed Share of Active: 50.0%
- Months of Inventory: 9.0
- Median Sold Price: $948,500
- Sellers Received: 90.1% of asking price
Half of Tarpon Point’s active listings were previously on the market, the highest share in Cape Coral. Every returning seller came back at a lower price, with a median adjustment of nearly 10%. The 90.1% sold-to-list ratio is also the lowest here, the widest gap between asking and closing in this report. Most active inventory is 3+den product in Tarpon Landings, where the median sits around $1,167,000 with a median 128 days on market. With only 8 closings over four months, the sold median reflects a small group of transactions and can move on a single sale. Pending homes ($849,500 median, 30 DOM) point toward the middle of the range as the most active tier. Starting with a price grounded in recent closed sales is especially important here, as the relist share and sold-to-list ratio both confirm.
Search Tarpon Point homes for sale
Cape Coral Yacht Club
- Active Listings: 20
- Sold (Last 120 Days): 6
- Homes Pending: 7
- Previously Listed Share of Active: 60.0%
- Months of Inventory: 13.3
- Median Sold Price: $1,312,500
- Sellers Received: 92.7% of asking price
The Yacht Club area has the highest share of previously listed homes in Cape Coral, with 60% of active inventory on a second attempt. Despite that, pending transactions (7) now exceed recent closings (6). Homes range from 1959 builds through 2025, so age and condition vary widely. With only 6 closings over four months, the sold median ($1,312,500) skews toward higher-end waterfront homes, while pending homes carry a $575,000 median, a different price range than what has been closing. Every recent closing settled below list price, with buyers negotiating about 7% off asking. Returning sellers adjusted by a median of roughly 4%, the smallest in the group, and many remain available. What has actually sold and what is going under contract offer a more grounded reference point than what is currently listed.
Search Cape Coral Yacht Club homes for sale
How Cape Coral Compares Across the Region
The table below places Cape Coral alongside the four other major Southwest Florida markets. Cape Coral posted the highest sold-to-list ratio in the region (97.0%) and the third-strongest closed sales growth, behind Bonita Springs and Estero.
| City | Median Sold Price | Price/SF | Active Listings | Months of Supply | Sold-to-List | Closed Sales YoY |
|---|---|---|---|---|---|---|
| Fort Myers | $325,000 | $202 | 3,506 | 7.9 | 95.6% | +9.6% |
| Cape Coral | $375,000 | $218 | 3,091 | 6.3 | 97.0% | +16.0% |
| Estero | $425,000 | $252 | 753 | 6.3 | 96.4% | +18.1% |
| Bonita Springs | $565,000 | $308 | 1,245 | 8.4 | 95.5% | +23.0% |
| Naples | $665,000 | $346 | 6,153 | 8.8 | 95.2% | +15.2% |
Source: FGCMLS. All metrics reflect February 2026 single-month data unless otherwise noted. The sold-to-list ratio reflects the most recent list price at the time of contract, not the original asking price. The listing-level analysis sections (community profiles, competitive inventory, relist data) use 120-day snapshots to capture enough transactions for meaningful analysis.
For the full regional analysis, see the Southwest Florida housing market update.
What Cape Coral Homeowners Were Asking in Early 2026
The Cape Coral market was tightening faster than any other Southwest Florida city. Inventory fell 26.4% year over year, showings rose 22.9%, and competitive supply was 3.8 months. Sellers who priced to recent comparable sales reached contract in a median of 53 days, faster than a year earlier.
Buyers paid a median of 97.0% of asking price in February closings. Homes that sold within 30 days typically closed at 97% to 98%. Homes past 90 days on market closed closer to 94% to 95%. Homes that failed the first time sold for about 10.5% below their original asking price.
New construction had a 23.0% relist rate compared to 29.2% for resale, and relisted new homes made smaller price cuts. New homes also sold faster (median 42 days on market vs. 71 for resale). New construction made up 34.4% of active inventory, so buyers in that segment had plenty of choices.
It depends on your priorities. Sandoval had the lowest relist rate (21.7%) and the most balanced numbers among featured communities. Tarpon Point and the Yacht Club area offered waterfront access, with deeper inventory and wider negotiation.
Cape Coral tied Estero for the tightest overall months of supply (6.3) in the region, with competitive supply of 3.8 behind Estero’s 3.6. Showings per listing (4.3) were the highest in the region. Prices were more stable (median down 3.2% vs. 12.2% in Fort Myers), and homes sold faster (53 median days on market vs. 61 in Fort Myers). Cape Coral’s $375,000 median was roughly half of Naples.
Final Thoughts on the Cape Coral Housing Market
In February 2026, Cape Coral was moving toward balanced conditions for properly priced homes. Overall months of supply tied Estero for the tightest in the region, competitive supply was the second tightest, and showing activity was the strongest. Sellers who did their homework on comparable sales found receptive buyers. The 13.3% ask-bid gap above $500,000 showed that sellers in the upper price tiers still needed to adjust expectations.
Search Cape Coral homes or reach out to our team to talk through what this data means for your property or your next purchase.
Most homeowners feel overwhelmed when it’s time to move. At Worthington Realty, we provide personalized guidance and clear communication so that you feel heard, valued, and confident in your decisions.
Explore the March 2026 Southwest Florida Market Series
- Southwest Florida Housing Market Update
- Fort Myers Housing Market Update
- Estero Real Estate Market Update
- Bonita Springs Housing Market Update
- Naples Housing Market Update
Explore Homes for Sale and Learn About Living In:
Fort Myers | Cape Coral | Estero | Bonita Springs | Naples
To better understand what these numbers mean, see how we interpret housing market data in Southwest Florida.
