

This is a past report. It covers Cape Coral market data for October 2025. For current numbers, see our Cape Coral housing market page.
Prices Rebound 3.4% as Buyer Demand Jumps 68% Over Last Year
Cape Coral’s housing market strengthened in October 2025. It posted one of the strongest pending-sales gains in Southwest Florida and had both the fastest sales pace and the tightest supply in the region. After a year of price corrections, the market recorded its strongest monthly price gain in more than a year, a sign that buyers and sellers were starting to meet in the middle.
MLS data through October 2025 showed how pricing, supply and buyer activity were changing heading into season.
Key Takeaways, October 2025 Data
- Median sale price: $366,903 (up 3.4% month over month, down 5.9% year over year)
- Buyer demand: Pending sales up 68.3% year over year (278 → 468), among the strongest gains in Southwest Florida
- Fastest pace: Homes selling in 60 days median (flat month over month, up 9.1% year over year)
- Inventory: 6.1 months of supply, tightest in SWFL and closely followed by Estero at 6.5 months
- Closed sales: 430 (up 11.1% year over year)
Cape Coral Real Estate: Pricing and Inventory
The median sale price rose to $366,903 in October, up roughly $12,000 from September and the strongest monthly advance in over a year. Prices remain 5.9% lower than last October, but the recent lift points to a steadier setting after last year’s reset.
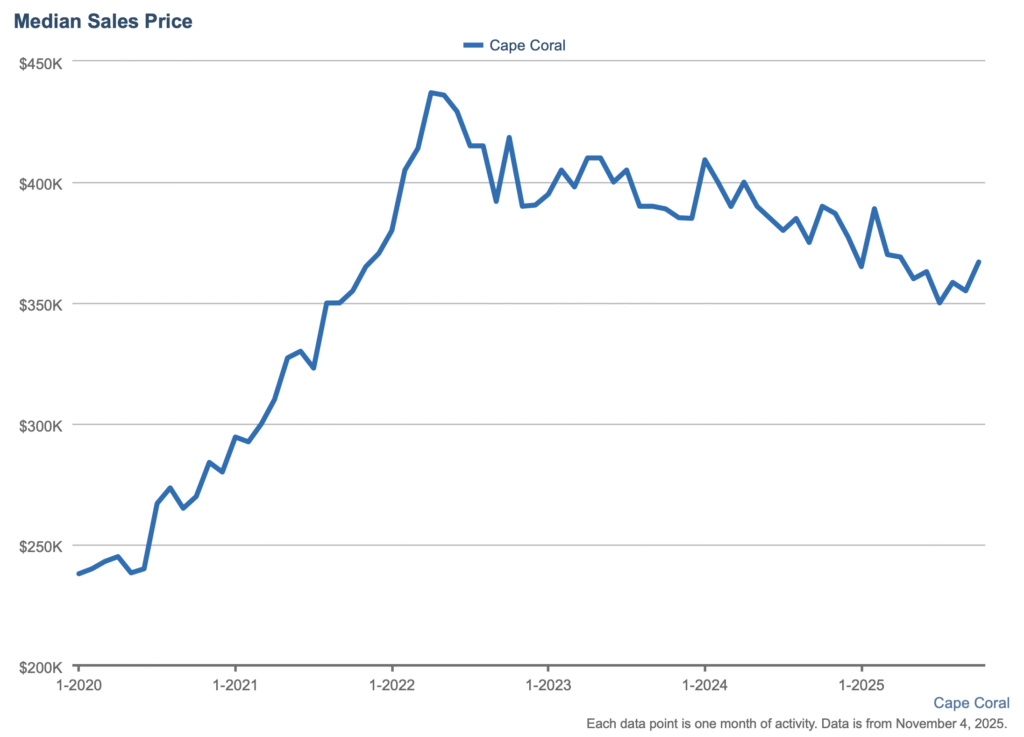
Price per square foot held at $215 (flat month over month, down 5.3% year over year). That steadiness suggests realistic pricing across home sizes is meeting buyer expectations. Sellers who align with recent comparables are seeing cleaner results.
Active listings slipped to 2,899 (down 1.1% month over month and 11.3% year over year). Months supply sits at 6.1, the tightest in Southwest Florida and closely followed by Estero at 6.5, with Fort Myers at 7.3, Bonita Springs at 7.5, and Naples at 7.8. The Federal Reserve’s national estimate is near 4.6 months, so Cape Coral still leans buyer-favorable while moving toward the edge of balance.
Cape Coral Market Summary: October 2025 Data (Preliminary)
| Cape Coral Metrics | Value | Month-over-Month Change | Year-over-Year Change |
|---|---|---|---|
| Median Sale Price | $366,903 | +3.4% | −5.9% |
| Pending Sales | 468 | −0.2% | +68.3% |
| Closed Sales | 430 | −4.2% | +11.1% |
| New Listings | 776 | +13.8% | +3.7% |
| Homes for Sale | 2,899 | −1.1% | −11.3% |
| Months Supply | 6.1 | −4.7% | −14.1% |
| Median Days on Market | 60 | 0.0% | +9.1% |
| Median % of List Price | 96.9% | −0.4 pts | −0.7 pts |
Buyer Demand and Pending Sales in Cape Coral
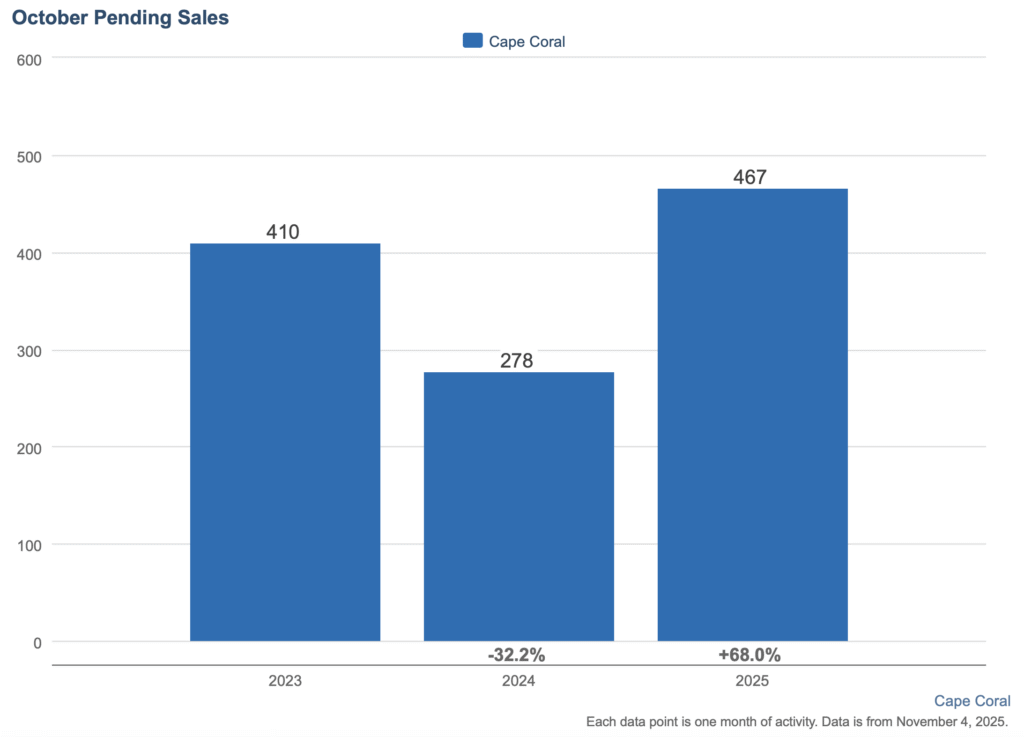
Buyer activity accelerated sharply in October, with 468 pending sales—a 68% increase year over year and one of the strongest surges across Southwest Florida. This growth reflects improved buyer confidence and realistic pricing after months of correction.
The typical property went under contract after seven showings, down from eight a year ago, showing buyers are moving faster when price and condition align.
Fresh inventory helped maintain momentum. 776 new listings entered the market in October—up nearly 14% from September—giving buyers more options as the winter season begins.
Days on Market and Selling Conditions in Cape Coral
Homes spent a median of 60 days on the market in October, unchanged from September and continuing Cape Coral’s position as the fastest-selling market in Southwest Florida:
- Cape Coral: 60 days (fastest)
- Estero: 65 days
- Fort Myers: 69 days
- Naples: 85 days
- Bonita Springs: 87 days
The median sale-to-list ratio of 96.9% leaves buyers about three percent of negotiating room—tighter than Fort Myers (95.5%) and Naples (94.8%). This narrowing gap reflects stronger buyer competition and improved pricing discipline from sellers.
Homes priced within five percent of recent comparables are typically selling within the 60-day median, while overpriced listings tend to linger until adjusted.
What This Meant for Cape Coral Buyers
In October 2025, Cape Coral still technically leaned toward a buyer’s market, but it was moving toward balance. The 68% jump in pending sales showed competition returning. With 6.1 months of supply, buyers still had room to negotiate, typically around 3% below list, but that room was narrowing.
The $12,000 monthly price gain suggested the correction might be ending.
What This Meant for Cape Coral Sellers
October 2025 brought the clearest signal yet that conditions were improving for sellers. Prices rose 3.4% in one month, pending sales passed 460, and homes sold faster here than anywhere else in Southwest Florida.
Sellers priced in line with recent comparables sold in roughly 60 days. Listings priced above the market sat longer and eventually adjusted.
With new listings up 14%, competition was still real. Condition, staging and marketing made a measurable difference.
What This Meant for Cape Coral Investors
A $366,903 median price, 60-day turnover and 68% growth in pending sales pointed to both affordability and liquidity for long-term investors.
Returns depended on realistic purchase prices, insurance costs and rental positioning.
Cape Coral Market Outlook as of November 2025
After more than a year of correction, Cape Coral was stabilizing. The $12,000 price jump, renewed buyer activity and firmer list-to-sale ratios pointed toward normal seasonal balance.
The 468 pending sales from October were expected to close through November and December.
At the time, we noted Cape Coral could reach a balanced market in early 2026 if mortgage rates and insurance costs held steady.
For those who love to dig deeper into the data, you can explore the rest of our November market reports across Southwest Florida:
- Southwest Florida Regional Market Overview
- Fort Myers Real Estate Market Update
- Estero Real Estate Market Update
- Bonita Springs Real Estate Market Update
- Naples Real Estate Market Update
Each report breaks down pricing, inventory, and demand patterns city by city—helpful for agents, investors, and anyone who geeks out over the numbers as much as we do.
Frequently Asked Questions
Technically a buyer’s market, with 6.1 months of supply, but right at the edge of balance. Pending sales were up 68% from a year earlier.
Prices rose 3.4% month over month to $366,903, the strongest monthly gain in over a year. Year over year, prices were still 5.9% lower.
The median was 60 days, unchanged from September and the fastest pace in Southwest Florida.
Buyers had realistic pricing and more inventory to choose from before seasonal competition built. The rebound suggested waiting could mean more buyers and fewer choices.
Affordability, strong demand and a return to realistic pricing after a year of correction.
Final Thoughts on the Cape Coral Real Estate Market
In October 2025, Cape Coral showed clear signs of a turning point. After a year of correction, October brought both a price rebound and a jump in buyer activity. The market entered winter with tightening inventory and the fastest sales in the region.
If you’d like to see what’s currently available, browse the latest Cape Coral homes for sale.
Most homeowners feel overwhelmed when it’s time to move. At Worthington Realty, we provide personalized guidance and clear communication so that you feel heard, valued, and confident in your decisions.
Methodology & Sources: All market statistics were obtained from the Florida Gulf Coast MLS and analyzed by Worthington Realty. Data reflects activity through October 31, 2025 (retrieved November 3, 2025). Figures are deemed reliable but not guaranteed and may be revised by the MLS. Data is preliminary and subject to change as additional sales are reported or updated within the MLS system.
