

This is a past report. It covers Naples market data for January 2026. For current numbers, see our Naples housing market page.
Naples demand is rising, even as January closings lag.
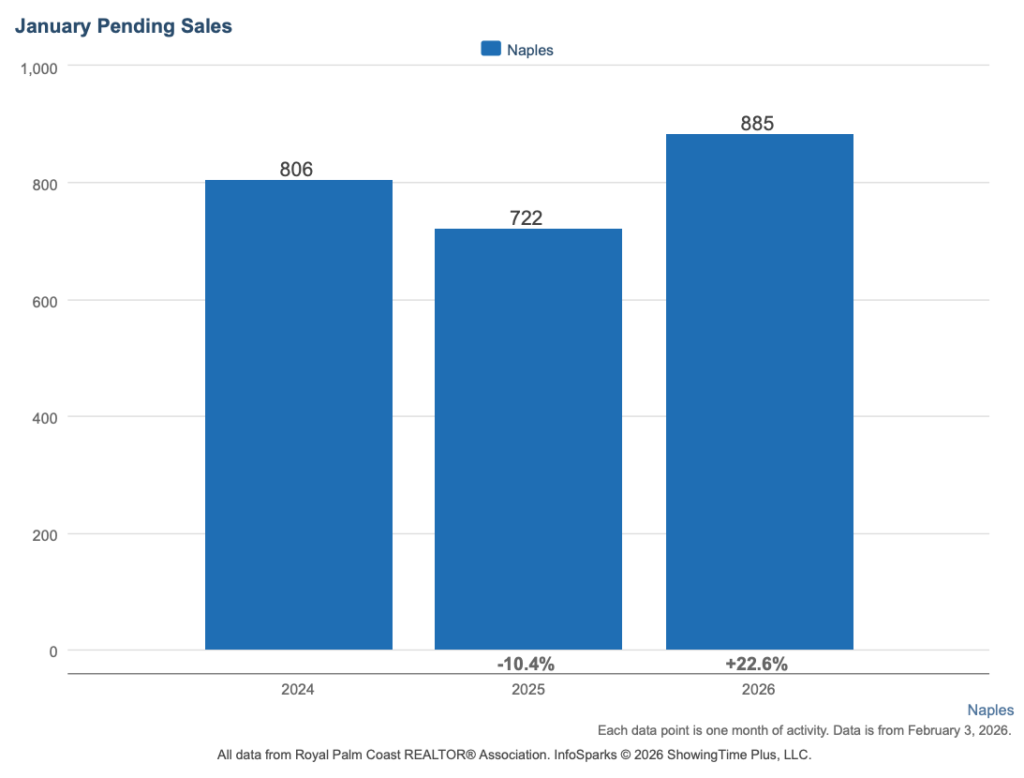
January 2026 data from the Florida Gulf Coast MLS (FGCMLS via Stellar MLS) showed a Naples real estate market where forward indicators were strengthening faster than closings. Pending sales rose 22.6% year over year to 885, showings per listing increased 12.9%, and the median number of showings needed to go pending fell from 8 in January 2024 to 7 in January 2025 to 6 in January 2026. Buyers were more active and making decisions a little faster than the year before.
Closed sales totaled 510, down 5.7% year over year. That comparison followed an unusually strong December, when 752 homes closed, up 31% from the year before, which made January look softer on its own. As of January 2026, pending sales had increased year over year for nine straight months, starting in May 2025.
Key Takeaways, January 2026 Data
- Buyer activity is accelerating. Pending sales rose 22.6% year over year, extending a nine-month streak of annual growth that began in May 2025, while buyers are converting in fewer showings than at any point in the past three Januaries.
- Closings are stronger than January alone suggests. December closings surged 31%, and the combined Dec–Jan window shows closings up 13.2% and dollar volume up 12.7%.
- Pricing is adjusting gradually. The headline median is down 3.6% from a peak baseline, while trailing averages show a smaller 2.9% decline and price per square foot is flat year over year.
- The supply surge has normalized. New listings fell 21.3% year over year to 1,752, following an unusually elevated January 2025 that ran 48% above the prior four-year average.
- Pricing accuracy varies sharply by community. Re-list rates across featured Naples communities range from 18% to 41%, with timelines and outcomes diverging based on initial pricing alignment.
Naples Compared to Southwest Florida
| Market | Median Price | YoY Change | Closed | Closed YoY | Pending | Pending YoY | Months Supply | Median DOM |
|---|---|---|---|---|---|---|---|---|
| Fort Myers | $350,000 | -7.9% | 306 | -1.3% | 588 | +29.5% | 7.7 | 43 |
| Cape Coral | $352,450 | -3.4% | 322 | +6.3% | 595 | +39.7% | 6.4 | 45 |
| Estero | $530,000 | -13.1% | 95 | +3.3% | 160 | +23.1% | 6.9 | 52 |
| Bonita Springs | $567,500 | +0.4% | 120 | +10.1% | 233 | +33.9% | 8.4 | 47 |
| Naples | $651,000 | -3.6% | 510 | -5.7% | 885 | +22.6% | 8.9 | 59 |
| SWFL Region | $419,950 | -4.6% | 1,852 | 0.0% | 3,276 | +28.2% | 8.1 | 53 |
Naples operates at the highest price point in Southwest Florida, and higher-priced transactions naturally take longer to move from contract to closing table. The 59-day median DOM reflects that pace. While January closings trailed last year on a single-month basis, the two-month picture tells a different story. Combined December–January closings rose 13.2% year over year (1,115 to 1,262), in line with Cape Coral (+12.4%) and stronger than Fort Myers (+9.7%). Dollar volume over that same window increased 12.7%, from $1.33 billion to $1.50 billion.
The pending-to-closed ratio of 1.74, up from 1.33 last January, is the highest among these markets, indicating a transaction pipeline that often shows up in closings in the months ahead.
For broader context, see our Southwest Florida Real Estate Market Report – February 2026. To see how this local trend fits into the broader statewide picture, read Florida Housing Ends 2025 Stronger Than Expected (Florida Realtors).
Naples Market Snapshot
- Median Sale Price: $651,000
- Year-over-Year Price Change: -3.6% (headline) | approximately -2.9% (six-month trailing average)
- Closed Sales: 510, down 5.7% year over year (Dec–Jan combined: up 13.2%)
- Pending Sales: 885, up 22.6% year over year
- Months of Supply: 8.9
- Median Days on Market: 59 days
- Sale-to-List Ratio: 95.1%
- Median Price Per Square Foot: $350
Buyer interest in Naples is building, while conditions still support careful decision-making. Homes are spending roughly two months on the market, and the 95.1% sale-to-list ratio indicates negotiation remains part of most transactions. Buyers looking at homes for sale in Naples are comparing across communities and price points, while homes priced in line with recent comparable sales continue to generate the strongest activity.
Supply and Demand in the Naples Housing Market
In the Naples real estate market, inventory peaked at 7,474 active listings in March 2025, the highest level in the dataset. Since then, the market has been absorbing that excess through a combination of normalizing supply and strengthening demand.
Active listings in January 2026 totaled 6,028, down 11.8% from last January’s 6,838. New listings declined 21.3% year over year, but context matters. January 2025 recorded 2,225 new listings, which was 48% above the 2021–2024 January average of 1,502. The current figure of 1,752 remains 17% above that historical norm, signaling normalization rather than a seller retreat.
Seasonality reinforces this trend. Active listings rose 8.0% from December to January (5,584 to 6,028). In the prior two years, the December-to-January increase was 16.5% and 19.1%. The seasonal inventory wave arrived more modestly this year, contributing to months of supply improving even with the typical January inventory bump.
On the demand side, the showings-to-pending trend is one of the clearest signals in the data. It took a median of 8 showings to produce a pending contract in January 2024, 7 in January 2025, and 6 this January. Combined with a 22.6% increase in pending sales, buyers are arriving more informed and committing more efficiently.
Months of supply peaked at 12.1 in March 2025 and has improved 26.4% to the current 8.9. While month-to-month fluctuations have occurred — supply ticked up seasonally in October and November before easing again in December — the broader trajectory since the spring peak reflects a market that has been steadily absorbing excess inventory. Naples remains the highest among major SWFL markets, but the direction of travel is clear.
Pricing Trends in the Naples Real Estate Market
The 3.6% year-over-year median price decline in the Naples housing market compares against the highest monthly median in the dataset. When measured using trailing averages, pricing has adjusted more gradually, with a six-month decline of approximately 2.9%.
This mirrors what we observed in the Estero real estate market update – February 2026, where an unusually high January 2025 baseline exaggerated the year-over-year comparison.
At $350 per square foot, Naples pricing is flat compared to January 2024 but down 3.3% from last year’s $362. Price per square foot helps filter out sales-mix distortion and suggests pricing pressure has been modest. The current median remains 62.7% above January 2021 levels ($400,000), underscoring that the market is adjusting from a peak rather than unwinding prior appreciation.
The sale-to-list ratio declined gradually from 96.4% in January 2024 to 95.7% in January 2025 to 95.1% this year. That trend reflects increased negotiation leverage for buyers, particularly in Naples’ higher-priced segments.
Dollar volume totaled $677.5 million in January, down 6.4% on a single-month basis, consistent with the December–January timing dynamic described above. The average closed transaction was $1.33 million, essentially unchanged from a year ago, indicating the mix of homes reaching the closing table remains stable.
Naples Featured Communities
Grey Oaks
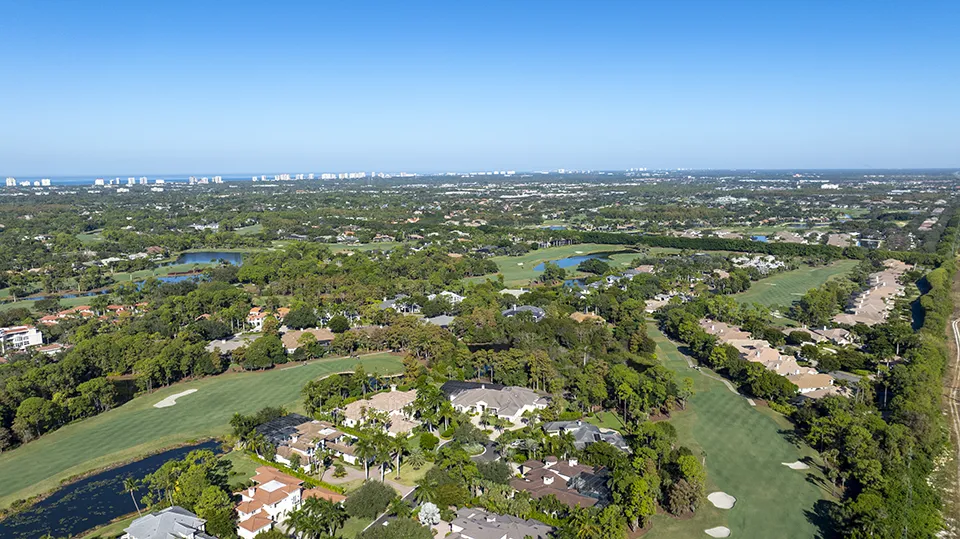
- Recent Activity: 16 sales in the past 120 days
- Pricing: Median sold $3,675,000 | Range $2,000,000–$16,500,000
- Home Types: Luxury single-family estates across multiple enclaves
- Market Snapshot: 5.5 months of supply | 134-day median DOM | 92.6% sale-to-list
Grey Oaks operates at the highest price point among the featured communities. The 92.6% sale-to-list ratio reflects meaningful negotiation typical of the ultra-luxury segment. Only 18% of current listings previously came off market and returned, the lowest re-list rate in this group. With 16 sales in the lookback period, individual transactions carry greater influence on pricing trends.
Explore homes for sale in Grey Oaks to view current luxury inventory and pricing trends.
Esplanade
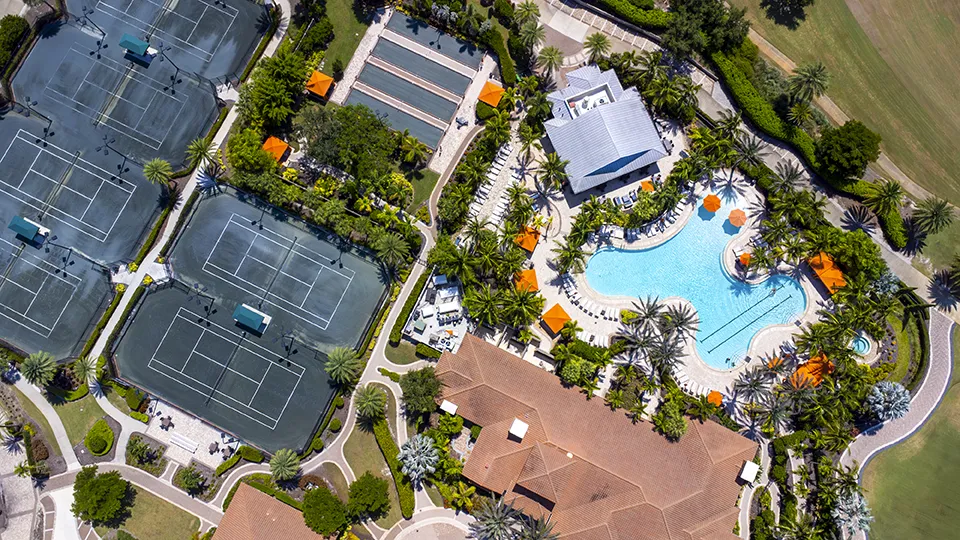
- Recent Activity: 22 sales in the past 120 days
- Pricing: Median sold $1,587,500 | Range $470,670–$3,400,000
- Home Types: Single-family homes and villas in a golf community
- Market Snapshot: 6.2 months of supply | 60-day median DOM | 96.3% sale-to-list
Esplanade is operating with the tightest inventory in this analysis. Homes are moving in a median 60 days at 96.3% of list price. Among current listings, 32% previously came off market and returned, with fresh and re-listed homes showing nearly identical time on market (78 vs 79 days).
Search homes for sale in Esplanade to compare current inventory with recent closed prices.
Pelican Bay
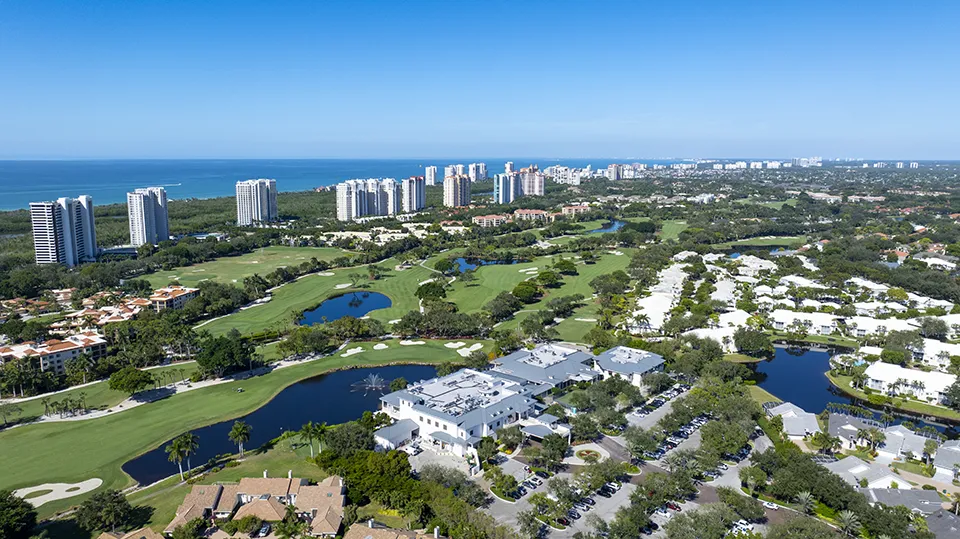
- Recent Activity: 89 sales in the past 120 days
- Pricing: Median sold $1,800,000 | Range $525,000–$12,125,000
- Home Types: Condos, villas, and single-family homes across 87 neighborhoods
- Market Snapshot: 9.4 months of supply | 64-day median DOM | 93.5% sale-to-list
Pelican Bay posted the highest sales volume in this group, with 89 transactions. The wide price range reflects its diverse mix from high-rise condos to beachfront estates. Among current listings, 34% previously came off market and returned, with fresh and re-listed homes showing identical time on market at 89 days. The 93.5% sale-to-list ratio reflects active negotiation across price points.
Explore homes for sale in Pelican Bay to compare listings across the community’s wide range of neighborhoods and price points.
Isles of Collier Preserve
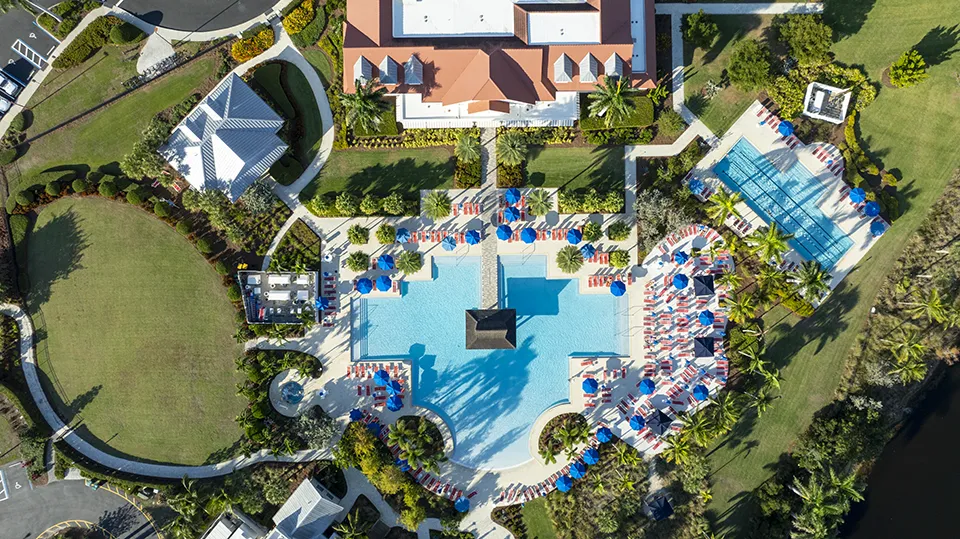
- Recent Activity: 26 sales in the past 120 days
- Pricing: Median sold $955,000 | Range $650,000–$3,600,000
- Home Types: Single-family homes in a nature-focused master-planned community
- Market Snapshot: 10.8 months of supply | 56-day median DOM | 97.0% sale-to-list
Isles of Collier Preserve shows the highest sale-to-list ratio in this group at 97.0%. Among current listings, 41% previously came off market and returned, the highest re-list rate in this set of communities. Re-listed homes are moving faster than fresh listings (62 vs 86 days), indicating that pricing adjustments are helping sellers align with current buyer expectations.
View homes for sale in Isles of Collier Preserve to understand current inventory and pricing.
Lely Resort
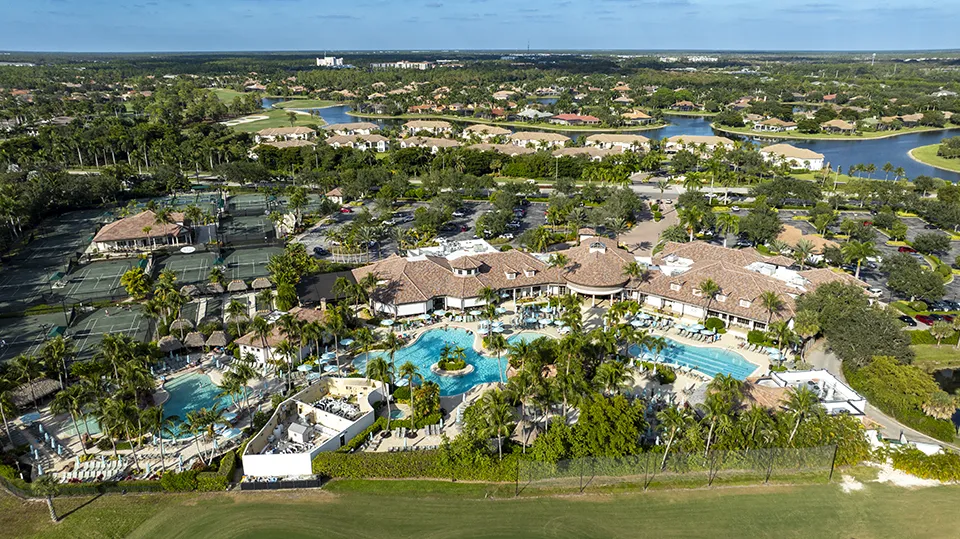
- Recent Activity: 65 sales in the past 120 days
- Pricing: Median sold $700,000 | Range $290,000–$3,350,000
- Home Types: Condos, coach homes, villas, and single-family homes across 45 neighborhoods
- Market Snapshot: 10.2 months of supply | 74-day median DOM | 94.4% sale-to-list
Lely Resort continues to show consistent transaction volume, with 65 sales over the past 120 days. The wide price range reflects the community’s diverse product mix. Among current listings, 39% previously came off market and returned, with re-listed homes taking longer than fresh listings (83 vs 61 days), reinforcing the value of pricing competitively from the start.
Search homes for sale in Lely Resort to explore current inventory across the community’s neighborhoods.
Vineyards
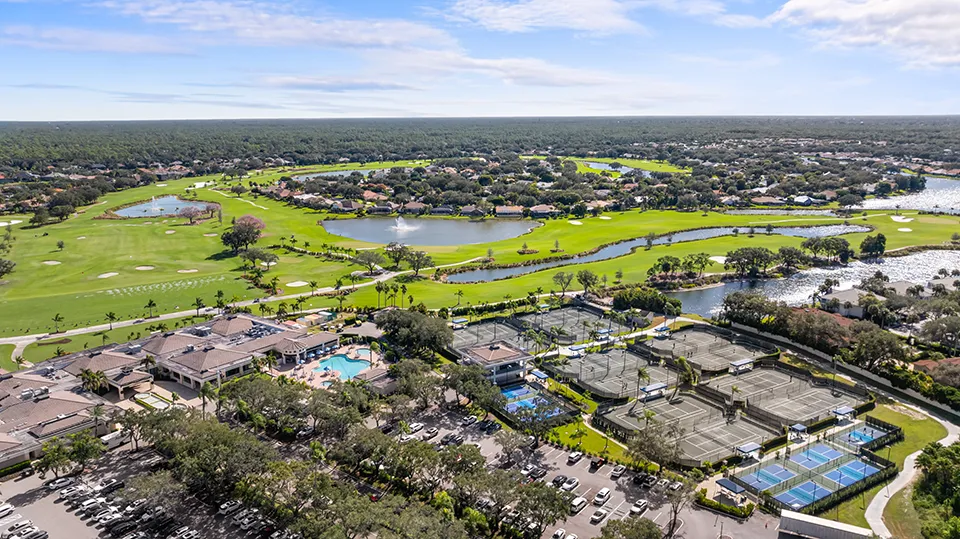
- Recent Activity: 32 sales in the past 120 days
- Pricing: Median sold $817,500 | Range $250,000–$2,350,000
- Home Types: Condos, villas, and single-family homes across 33 neighborhoods
- Market Snapshot: 13.6 months of supply | 61-day median DOM | 95.5% sale-to-list
Vineyards carries the highest inventory level among the featured communities at 13.6 months of supply. Despite that, homes that sell are moving in a median 61 days. Among current listings, 23% previously came off market and returned, with re-listed homes sitting longer than fresh listings (93 vs 78 days). The broad product mix continues to influence pricing and timelines.
View homes for sale in Vineyards to see how current inventory levels compare to recent buyer activity.
What Naples Homeowners Were Asking in Early 2026
Rising pending sales usually lead to more closings in the following months. January’s closing count was also compared against an unusually strong December. December and January combined, closings were up 13.2%.
Prices were down slightly, but against the single highest month on record. With the month-to-month swings smoothed out, the decline was closer to 3%, and price per square foot was flat compared to two years earlier.
Recent sales mattered most. Communities with lower re-list rates showed better alignment between list and sale price from the start. Where re-list rates were higher, sellers often adjusted after pricing too high at first. In both cases, homes that sold closed at roughly 94% to 97% of median list price.
Yes, with context. The prior year’s starting point was unusually high. Months of supply had come down from its spring 2025 peak as demand strengthened and new listings normalized.
It favored deliberate buyers. There was real choice across communities and price points, negotiation was part of most deals, and buyers who found the right home were committing faster than in prior years.
Final Thoughts
In January 2026, Naples’ leading indicators lined up. Pending sales had risen year over year for nine straight months, showings per listing were improving, and months of supply had come down from its 2025 peak. Price per square foot held steady year over year.
For buyers, Naples offered choice and room to negotiate. For sellers, pricing close to recent comparable sales drove the strongest outcomes.
If you want to see how these trends apply to your home or neighborhood, you can search Naples homes for sale or contact our team to walk through the numbers together.
Most homeowners feel overwhelmed when it is time to move. At Worthington Realty, we provide personalized guidance and clear communication so you feel heard, valued, and confident in your decisions.
Methodology: This report draws from Florida Gulf Coast MLS data, including InfoSparks aggregate statistics from January 2021 through January 2026, transaction-level analysis of featured Naples communities, and a re-list review identifying properties that previously expired, terminated, or withdrew within the past 12 months. Trailing averages and multi-month windows are used where single-month comparisons are distorted by timing or baseline anomalies. The pending-to-closed ratio is calculated from January monthly data and reflects the relationship between current buyer activity and completed transactions.
