


Estero Sale-to-List Ratio in September 2026
At a glance
Estero's sale-to-list ratio was 96.8% in September 2026, up from 95.8% a year earlier. Sellers received a larger share of their final asking price, with smaller discounts than a year ago.
Estero buyers have also been busier than last year. Showings and contracts have run above last year for most of 2026, and the number of homes for sale has fallen by nearly a third. For the regional picture, see the September 2026 Southwest Florida pending sales report.
September's InfoSparks figures from the Florida Gulf Coast MLS (FGCMLS via Stellar MLS) are preliminary. We will update this report following the October 10 data pull and revise any affected comparisons or conclusions. Matrix listing counts and property histories reflect the October 1 snapshot. MLS records can change as more information is reported, so comparisons use the latest records and earlier months can differ from figures published before.
Key Takeaways
- The sale-to-list ratio has been above last year for five months in a row through September, and the three-month rolling ratio reached 96.3%.
- Pending sales reached 100, up 20.5% year over year. The three-month rolling count of 299 was up 8.7%.
- Active listings stood at 456, down 30.2% from a year earlier, and months of supply was 3.6 against 6.3.
- The three-month rolling median was $503,250, up 0.7%. Rolling price per square foot rose to $250 from $248 in August.
- Listings averaged 3.8 showings, up 26.7% year over year.
Estero Buyers Kept Showing Up and Signing Contracts
Estero closes about 100 homes in a typical month, so single-month counts move sharply on a few dozen transactions. The three-month rolling figures combine July, August and September, which reduces the influence of any one month. Back-to-back rolling figures share two of their three months, so a rolling streak should be read as one ongoing trend. This report uses them alongside the monthly figures.
Estero listings averaged 3.8 showings in September 2026, up from 3.0 a year earlier. On a three-month rolling basis, showings per listing have run above last year for 12 months in a row through September.
Pending sales reached 100 in September, up 20.5% from 83. The three-month rolling count was 299, up 8.7% from 275, and the rolling figure has been above last year in 11 of the last 12 months.
Homes that went under contract had 10 showings per listing beforehand, up from eight a year earlier, so listings are drawing more visits before a buyer commits.
Closings Held Close to Last Year
Estero recorded 91 closed sales in September 2026, down 3.2% from 94 a year earlier. The three-month rolling count was 284, down 2.4%. Dollar volume came in at $54.6 million.
Higher Mortgage Rates Raised the Payment on a Median-Priced Estero Home
The 30-year fixed rate averaged 7.03% in the week of September 24, 2026, according to the Freddie Mac Primary Mortgage Market Survey, up from 6.66% in late August and 6.30% a year earlier. The October 1 survey reported 7.28%.
The calculation below uses Estero's three-month rolling median of $503,250, the steadier price measure for this market. With 20% down, a buyer would borrow $402,600, and principal and interest at 7.03% come to about $2,687 a month.
Est. monthly principal and interest
- September 2026$2,687/mo$503,250 rolling median at 7.03%
- At last year’s rate$2,492/mo$503,250 rolling median at 6.30%
- September 2025$2,476/mo$500,000 rolling median at 6.30%
- At the October 1 rate$2,755/mo$503,250 rolling median at 7.28%
The rolling median is close to where it was a year ago, so nearly all of the roughly $211 monthly increase comes from the higher rate.
These figures exclude property taxes, insurance, association fees and the community development district assessments common in Estero. The survey average is not a rate quote available to any particular buyer, and cash purchases are not tied to a mortgage payment.
Homes for Sale in Estero Remain Down by Nearly a Third
Estero had 456 active listings in September 2026, down 30.2% from 653 a year earlier. The monthly count rose from 446 in August, its first increase since January. The three-month rolling count of 463 has still fallen for six months in a row.
New listings came in at 154, up from 129 in August and close to the 156 recorded a year earlier. Last year, new listings jumped from 156 in September to 271 in October as sellers prepared for winter.
Published months of supply was 3.6, down from 6.3 a year earlier. The measure divides homes for sale by the average monthly pending sales of the last 12 months. Four to six months is generally read as balanced, so 3.6 sits below that range on the seller side. The three-month rolling reading of 3.7 has declined for eight consecutive months.
Homes sold in a median 60 days on market in September, against 64 a year earlier. On a rolling basis the median was 67 days, down from 85.
The Estero Sale-to-List Ratio Has Run Above Last Year Since May
The sale-to-list ratio compares a home's sale price with the list price in place when it went under contract. A reading of 96.8% means the median seller accepted about 3.2% less than that final asking price.
| Month | Sale-to-List Ratio | Same Month 2025 |
|---|---|---|
| May 2026 | 96.5% | 96.2% |
| June 2026 | 96.0% | 95.0% |
| July 2026 | 96.3% | 95.8% |
| August 2026 | 95.8% | 95.1% |
| September 2026 | 96.8% | 95.8% |
The ratio has been above last year for five months in a row through September. On a three-month rolling basis it reached 96.3%, above last year for a fourth month.
September has not favored sellers on this measure in recent years. The September ratio was 97.3% in 2023, 96.1% in 2024 and 95.8% in 2025. This year's 96.8% breaks that run of yearly declines.
Why the Ratio Reflects Earlier Negotiations
The sale-to-list ratio is recorded at closing, weeks after the contract is signed. It reflects negotiations that took place while showings were running above last year and supply was falling. That reading is consistent with the other measures, and it can also rise when sellers cut asking prices or a different mix of homes sells.
The ratio uses the final asking price, which already includes any reductions made during the listing. A seller who cut the price twice and then received 97% of the last price may have received much less than the opening ask. The community profiles below compare September closings with their opening prices for that reason.
For a buyer, 96.8% is citywide context. It is not a target for an offer on a specific home, since condition, price range and listing history all shape what an individual home sells for.
Estero Prices on a Rolling Basis Are Close to Last Year
Estero's single-month median sale price was $475,000 in September 2026, down 12.8% from $545,000 a year earlier. That figure rests on 91 closings, and the mix of homes that closed moves it on its own.
The three-month rolling median gives the steadier read. It finished September at $503,250, up 0.7% from $500,000 a year earlier. The rolling median has been above last year for three months in a row through September.
Rolling price per square foot was $250, up from $248 in August and 0.4% below September 2025. It had declined from $257 in June to $253 in July and $248 in August, so September ended that two-month decline. The year-over-year decline has narrowed in each of the last four months.
| Month | Rolling Price per Sq. Ft. | Change From Last Year |
|---|---|---|
| May 2026 | $257 | −6.2% |
| June 2026 | $257 | −5.9% |
| July 2026 | $253 | −3.1% |
| August 2026 | $248 | −1.6% |
| September 2026 | $250 | −0.4% |
First-Attempt and Relisted Homes Performed Differently
Across closings in the 120 days through October 1, 2026, Estero homes that sold on their first listing attempt had a median 64 days on market. Homes that sold after relisting accumulated a median 240 days across their attempts. Those figures cover 350 and 68 closings respectively. The window had 444 closings in all. The other 26 sold on their first listing with no days on market recorded, so they are left out of the day counts. The 15.3% relisted share below is measured against all 444.
First-attempt homes sold at a median $518,750. Relisted homes opened at a median $572,450 and closed at a median $532,500, a median per-home difference of $38,450. Relisted homes made up 15.3% of closings in the window.
The two groups differ in price, property type, condition and seller circumstances. The figures show how each group performed, and they do not establish that relisting caused the difference.
Estero's Re-list Rate was 25.0%, up from 20.1% in August. That covers 117 of the 468 active listings in Worthington's address-matched export with an expired, withdrawn or terminated record at the same address in the past 12 months. Of those, 43.6% came back at least 3% below the prior asking price. The other 56.4% returned at the same price or with a smaller cut.
When a home returns to the MLS under a new listing, its days-on-market counter starts over at zero. A buyer should check a listing's full history before treating it as new.
Estero Competitive Inventory and Ask-Bid Gap
Competitive Inventory is Worthington's screening view of active listings. It counts homes listed fewer than 180 days, except relisted homes that came back less than 3% below their prior price. Buyers can still consider the homes it sets aside. It divides by the same figure as published months of supply, the average monthly pending sales of the last 12 months.
Against Estero's average of 127.8 pending sales a month over the last 12 months, all 468 export listings read 3.7 months. Setting aside the 98 listings past the 180-day mark brings that to 2.9 months. Also setting aside relisted homes that came back less than 3% lower leaves 306 listings at 2.4 months.
The Ask-Bid Gap compares asking prices with recent sale prices, both per square foot. Estero ran 6.7% citywide, with active listings asking $266.62 against $249.88 on closings over the past 120 days.
By price range, the reading was 1.7% under $400,000 and 7.0% from $400,000 to $750,000. It was 9.3% from $750,000 to $1.5 million and 19.6% above $1.5 million, where it rests on 29 active listings and 21 closings.
The active and sold homes are different properties. They can differ in condition, location, age and finish, so the reading is not an offer discount.
Core Market Metrics, September 2026
Read this city's figures against its own recent history. Figures are preliminary.
Small figures show the change from September 2025.
| City | Median Sold Price | Median Price per Sq. Ft. | Active Listings | Months of Supply | Sold-to-List | Closed Sales YoY |
|---|---|---|---|---|---|---|
| Fort Myers | $340,000−1.3% | $197−3.4% | 2,460−18.6% | 5.3−27.4% | 96.0% | +1.7% |
| Cape Coral | $367,000+3.4% | $212−1.4% | 2,439−19.0% | 4.8−27.3% | 97.4% | −10.2% |
| Estero | $475,000−12.8% | $253−1.2% | 456−30.2% | 3.6−42.9% | 96.8% | −3.2% |
| Bonita Springs | $575,000+3.6% | $297−3.9% | 715−24.8% | 4.6−35.2% | 95.4% | −21.6% |
| Naples | $599,000+5.1% | $329+2.5% | 3,916−20.3% | 5.3−32.1% | 95.7% | −4.1% |
Source: FGCMLS, pulled October 1, 2026 (preliminary). Single-month data unless otherwise noted. Sold-to-list uses most recent list price at time of contract.
Worthington Market Lens, September 2026
| City | Competitive Inventory (Months) | Re-list Rate | Ask-Bid Gap (PPSF%) | Pending-to-Active Ratio | First-Attempt Median DOM | Median Total DOM After Relisting |
|---|---|---|---|---|---|---|
| Fort Myers | 3.6 | 23.9% | 7.5% | 22.7% | 66 days | 245 days |
| Cape Coral | 3.4 | 20.9% | 5.7% | 26.1% | 49 days | 224 days |
| Estero | 2.4 | 25.0% | 6.7% | 31.6% | 64 days | 240 days |
| Bonita Springs | 3.0 | 27.4% | 22.7% | 22.8% | 86 days | 231 days |
| Naples | 3.3 | 25.5% | 11.5% | 20.8% | 78 days | 246 days |
Source: FGCMLS (preliminary). Proprietary metrics use Worthington's address-matched property export, so active-listing denominators differ slightly from the published MLS counts in Table 1. Competitive Inventory months divide the filtered active-listing count by the city's average monthly pending sales over the last 12 months, the same figure published months of supply uses. Competitive Inventory uses a 180-day cutoff beginning with this report. Earlier reports used 90 days, so those figures should not be compared directly. This month, Pending-to-Active counts every home under contract on October 1, including contracts signed more than 120 days ago. We usually count only the past 120 days.
September 2026 Results for Estero Featured Communities
Each profile covers the 120 days from June 3 through October 1, 2026. The table compares each community with the August 2026 profiles and with the same 120 days in 2025. "Flat" means no change at all. Sale-to-list changes show in percentage points. Back-to-back 120-day windows share most of their sales, so a run of monthly readings should be read as one ongoing trend.
Each month we count pending homes whose contracts were signed in the past 120 days. This month we also pulled every pending home, to see how many contracts had been open longer than that. The current under-contract counts below include all pending homes, regardless of when the contracts were signed. Comparisons with August use the usual 120-day count, so they line up. "Spring" means the 120 days ending May 1, 2026, the same length as the current window. Months of supply can rise when the recent sales pace slows, so some narratives also show the figure at the spring pace. That figure is an illustration only, not a forecast or a seasonal adjustment. Each profile also shows Competitive Inventory and the Re-list Rate, figured the same way as the city numbers. Competitive Inventory months use the community's 120-day sales pace.
Bella Terra
Bella Terra homes sold at a median $453,750 over the 120 days ending October 1, 2026. The 42 sales ranged from $242,500 to $669,000.
| September 2026 | vs. August | vs. last year | |
|---|---|---|---|
| Median sold price | $453,750 | ↑ 0.9% | ↓ 1.4% |
| Homes sold (120 days) | 42 | ↓ 4.5% | ↑ 35.5% |
| Sellers received (of final asking price) | 97.8% | ↑ 0.2 pts | ↑ 1.3 pts |
On October 1, 22 homes were for sale and 14 were under contract, for about 2.1 months of supply. Competitive Inventory was 19 of those listings, about 1.8 months. The Re-list Rate was 13.6%, up 5.6 points from August, with 3 of the 22 listed before in the past year. September's five sales typically closed at 97.7% of their first asking price, about $10,000 below it. The number of sales has been above last year for eight months in a row, February through September, and the sale-to-list ratio has been above last year for 4 months in a row.
In September, Bella Terra had five closings, and none needed a price cut. A 2,048-square-foot lake-view home sold in five days at its full $514,900 asking price. A townhouse and a villa without water views took 42 and 93 days.
Sales here did not slow much for summer, with closings near 40 over 120 days from spring to fall. Homes under contract rose to 14 from seven in August, against 22 listings. Active listings ask a median $377,450 on homes about 195 square feet smaller than the ones that sold, with condos, villas and single-family homes all in the mix.
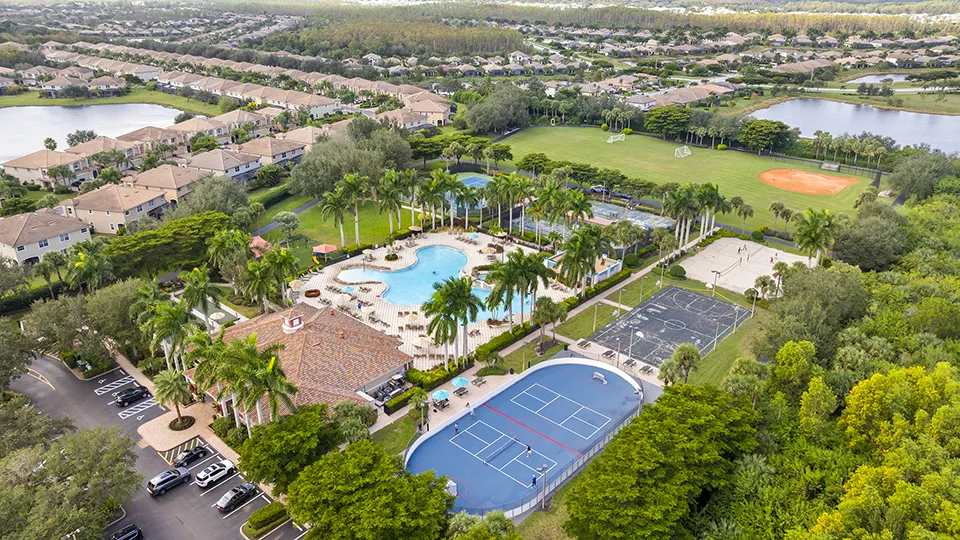
Cascades at Estero
Cascades at Estero homes sold at a median $400,000 over the 120 days ending October 1, 2026. The 9 sales ranged from $275,000 to $586,500.
| September 2026 | vs. August | vs. last year | |
|---|---|---|---|
| Median sold price | $400,000 | → flat | ↓ 2.4% |
| Homes sold (120 days) | 9 | → flat | → flat |
| Sellers received (of final asking price) | 94.6% | ↓ 0.9 pts | ↓ 1.9 pts |
On October 1, 4 homes were for sale and 5 were under contract, for about 1.8 months of supply. Competitive Inventory was 3 of those listings, about 1.3 months. The Re-list Rate was 25.0%, up 25.0 points from August, with one of the 4 listed before in the past year. September's four sales typically closed at 94.4% of their first asking price, about $27,400 below it. The median has been below last year for eight months in a row, February through September, and the sale-to-list ratio has been below last year for 7 months in a row.
In September, Cascades at Estero had four closings, all single-family homes built in 2003 and 2004, and three were relists. The two pool homes sold for $580,000 and $565,000, and the lake-view one closed at 97% of its first asking price. Two smaller homes of about 1,550 square feet sold for $332,000 and $350,000. The $332,000 sale came after four price cuts and 554 days on the market across listings.
Sales slowed for summer, from 20 closings in spring to nine now. Supply is still tight, with five homes under contract against four for sale.
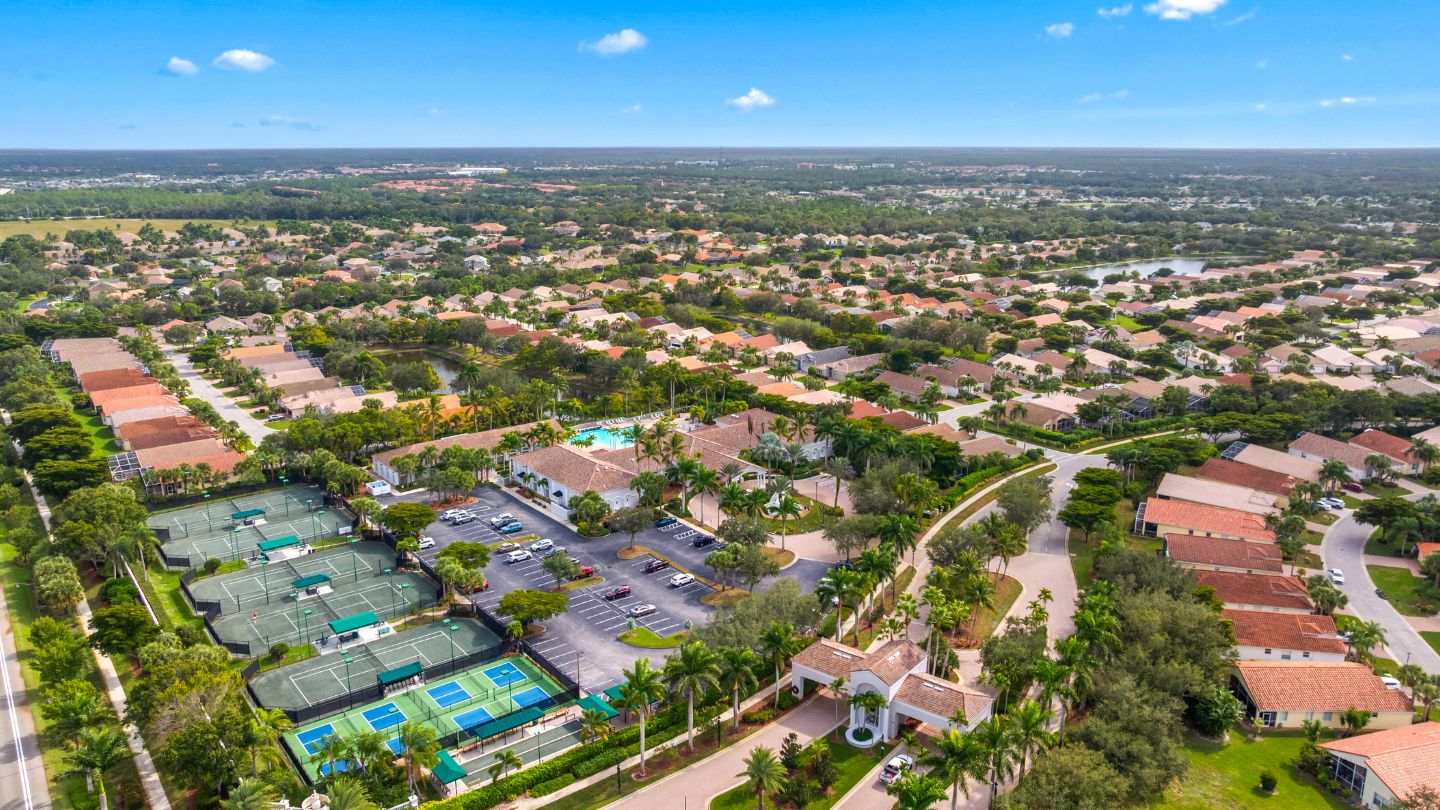
Grandezza
Grandezza homes sold at a median $591,500 over the 120 days ending October 1, 2026. The 18 sales ranged from $225,000 to $2,600,000.
| September 2026 | vs. August | vs. last year | |
|---|---|---|---|
| Median sold price | $591,500 | ↓ 1.3% | ↑ 2.9% |
| Homes sold (120 days) | 18 | ↓ 10.0% | ↑ 20.0% |
| Sellers received (of final asking price) | 94.7% | ↓ 0.3 pts | ↓ 0.3 pts |
On October 1, 15 homes were for sale and 3 were under contract, for about 3.3 months of supply. Competitive Inventory was 9 of those listings, about 2.0 months. The Re-list Rate was 33.3%, down 2.4 points from August, with 5 of the 15 listed before in the past year. September's three sales typically closed at 97.5% of their first asking price, about $24,900 below it.
In September, Grandezza had three closings, and the results followed home type. A Saraceno pool villa sold in two days for $635,000. A lakefront Villa Grande home sold in 20 days for $975,000, and both closed at 98% of their first asking price. A Sabal Palm condo with $14,364 in annual fees took 313 days and four price cuts to close at 80%. Higher carrying costs are one more thing a condo buyer weighs.
The median of the homes that sold is 2.9% above the same stretch last year. Sales slowed from 23 closings in spring to 18 now, a smaller summer drop than last year, and listings have risen two months in a row. Five Sabal Palm sales had a $330,000 median over the past 120 days and three Villa Grande sales $895,000.
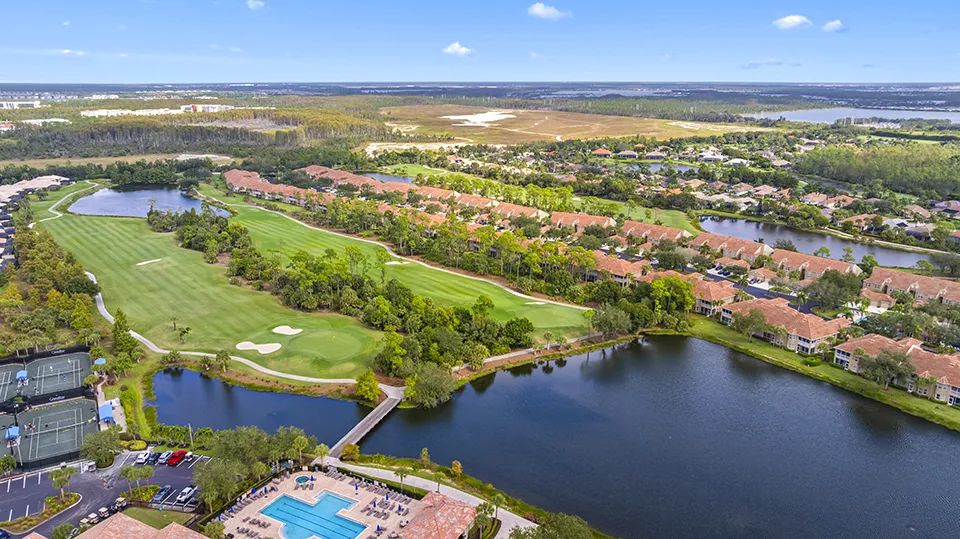
Stoneybrook
Stoneybrook homes sold at a median $460,000 over the 120 days ending October 1, 2026. The 10 sales ranged from $230,000 to $645,000.
| September 2026 | vs. August | vs. last year | |
|---|---|---|---|
| Median sold price | $460,000 | ↓ 11.5% | ↑ 5.1% |
| Homes sold (120 days) | 10 | ↓ 16.7% | ↓ 28.6% |
| Sellers received (of final asking price) | 95.6% | ↓ 1.2 pts | ↑ 1.3 pts |
On October 1, 9 homes were for sale and 5 were under contract, for about 3.6 months of supply. Competitive Inventory was 8 of those listings, about 3.2 months. The Re-list Rate was 22.2%, down 15.3 points from August, with 2 of the 9 listed before in the past year. September's two sales typically closed at 89.8% of their first asking price, about $42,450 below it.
In September, Stoneybrook had two closings, a 1,134-square-foot condo and a 1,541-square-foot pool home on the lake. The condo was a relist that had been on the market 151 days across listings before it sold for $230,000. The pool home took 107 days and a price cut to close at 88% of its first asking price.
The median of the homes that sold fell 11.5% from August and sits 5.1% above the same stretch last year, a swing that 10 sales can produce on their own. Sales slowed from 21 closings in spring to 10 now. Sellers received 95.6% of their final asking price, down two months in a row. Active listings ask a median $524,900 on homes about 385 square feet larger than the ones that sold.
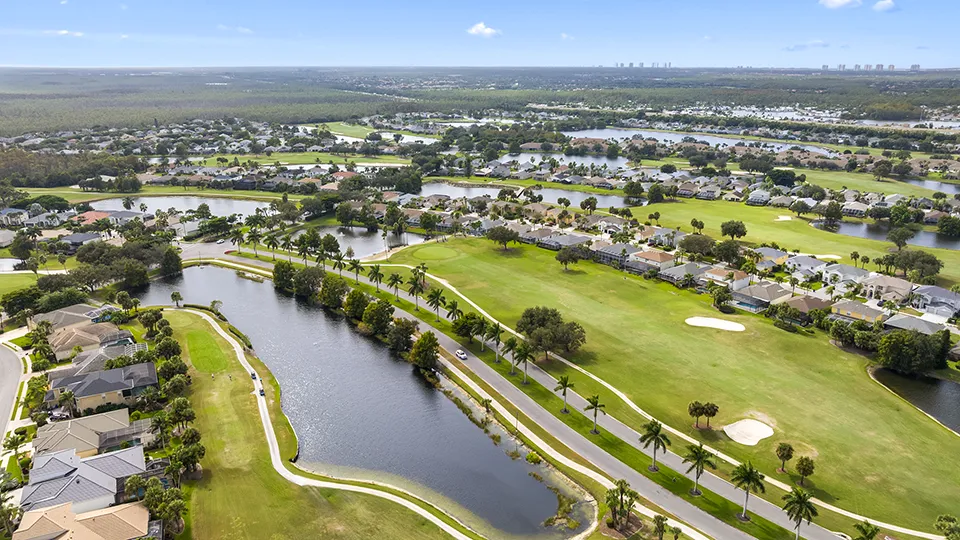
Verdana Village
Verdana Village homes sold at a median $630,000 over the 120 days ending October 1, 2026. The 55 sales ranged from $363,000 to $1,292,628.
| September 2026 | vs. August | vs. last year | |
|---|---|---|---|
| Median sold price | $630,000 | ↑ 0.8% | ↑ 6.5% |
| Homes sold (120 days) | 55 | ↓ 6.8% | ↓ 1.8% |
| Sellers received (of final asking price) | 98.3% | ↓ 0.1 pts | ↓ 1.3 pts |
On October 1, 34 homes were for sale and 13 were under contract, for about 2.5 months of supply. Competitive Inventory was 26 of those listings, about 1.9 months. The Re-list Rate was 14.7%, up 2.9 points from August, with 5 of the 34 listed before in the past year. September had 12 sales. The 10 with a first asking price on record typically closed at 95.1% of it, about $31,950 below. The median has been above last year for 6 months in a row, and the sale-to-list ratio has been below last year for 6 months in a row through September.
Seven of the 12 used conventional loans. Two were new builder homes recorded without MLS marketing, one with a $20,000 seller concession, and one resale was a short sale. A 2023 pool home on the lake sold in seven days. A furnished 3,302-square-foot lakefront pool home took 323 days and three price cuts to close at 88% of its first asking price.
Sales did not slow much for summer, with about 50 closings in spring and 55 now. New builder homes are still selling here alongside resales.
The Place at Corkscrew
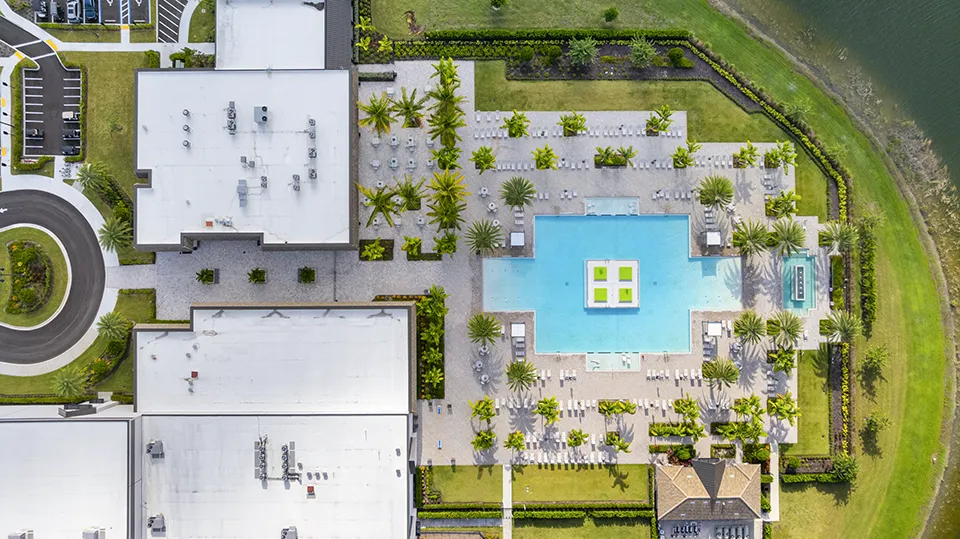
The Place at Corkscrew homes sold at a median $688,706 over the 120 days ending October 1, 2026. The 30 sales ranged from $508,000 to $1,220,000.
| September 2026 | vs. August | vs. last year | |
|---|---|---|---|
| Median sold price | $688,706 | ↓ 1.3% | ↓ 8.2% |
| Homes sold (120 days) | 30 | ↓ 11.8% | ↓ 3.2% |
| Sellers received (of final asking price) | 97.7% | ↑ 0.3 pts | ↑ 1.7 pts |
On October 1, 17 homes were for sale and 6 were under contract, for about 2.3 months of supply. Competitive Inventory was 15 of those listings, about 2.0 months. The Re-list Rate was 5.9%, up 5.9 points from August, with one of the 17 listed before in the past year. September had eight sales. The seven with a first asking price on record typically closed at 96.2% of it, about $26,000 below. The median has been below last year for eight months in a row, February through September, and the sale-to-list ratio has been above last year for 4 months in a row.
All eight were single-family homes built from 2018 to 2022, and none needed more than one price cut. Two of the eight were relists.
The median of the homes that sold has edged down each month from $700,000 in July. Sales slowed from 46 closings in spring to 30 now, a bigger summer drop than last year. Homes here come from two builders in a narrow age range.
Frequently Asked Questions
What is the sale-to-list ratio in Estero?
Sellers received a median 96.8% of their most recent asking price in September 2026, up from 95.8% a year earlier. The ratio has been above last year for five months in a row through September.
Did Estero home prices drop 12.8% in September?
That figure is the single-month median on 91 closings. The three-month rolling median was $503,250, up 0.7% from a year earlier, and rolling price per square foot was 0.4% lower.
How much below asking should a buyer offer in Estero?
The data does not support a single answer. The 96.8% citywide ratio is context. Offers are better built from closed comparable sales on similar homes.
Is 3.6 months of supply a seller's market?
Four to six months is generally read as balanced, so 3.6 sits below that range on the seller side. Conditions differ by price range.
What to Watch in Estero in October
The sale-to-list ratio is the first number to watch. It was 96.0% in October 2025, so an October reading above that would make six months in a row above last year.
Rolling price per square foot is the second. It stands at $250, 0.4% below last year after four months of a narrowing decline. October 2025's rolling figure was $259, and a reading above that level would put it above last year for the first time since early 2024.
An Estero pricing decision still depends on the community, price range, condition and closest comparable sales.
Most homeowners feel overwhelmed when it's time to move. At Worthington Realty, we provide personalized guidance and clear communication so that you feel heard, valued, and confident in your decisions.
An agent will reach out personally within one business day. No pressure, just answers.
Get notified when next month's report publishesAll data referenced in Worthington's market reports draws from the Florida Gulf Coast MLS (FGCMLS via Stellar MLS) unless otherwise noted.
Explore All Six September 2026 Reports
- Southwest Florida Pending Sales in September 2026
- Fort Myers Median Sale Price in September 2026
- Cape Coral Showings in September 2026
- Estero Sale-to-List Ratio in September 2026
- Bonita Springs Ask-Bid Gap in September 2026
- Naples Price Per Square Foot in September 2026
Explore Homes for Sale and Learn About Living In
For a full explanation of the indicators used in these monthly reports, see Worthington Realty's Southwest Florida market methodology.
Get the report
Free · Two quick steps · Unsubscribe anytime
What’s Your Estero Home Worth?
Pricing to real, recent comparables is what separates a quick sale from months on market. Start with your address. A Worthington agent follows up with a pricing range, the comparable sales behind it, and the next steps that fit your timing.
Your information stays with Worthington Realty and is never sold or shared.