
Bonita Springs Inventory Fell 28.7% Year Over Year, the Largest Drop in Southwest Florida
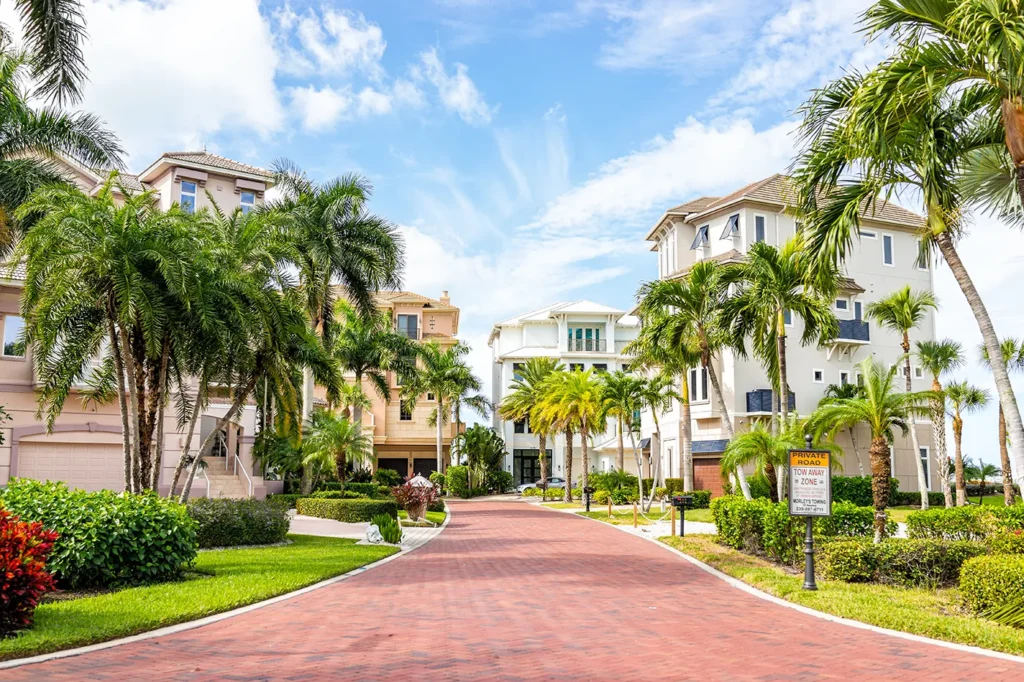
Bonita Springs inventory has dropped sharply over the past year. A drop like that usually gives sellers more pricing leverage. But here in Bonita, buyers are still measuring asking prices against recent sales, and the gap is widest at the top of the market.
Homes priced near recent sales are moving. Homes priced well above recent sales are more likely to sit, reduce, or come back later. For sellers above $750K, recent closings matter more than active asking prices. For buyers, the room to negotiate widens as you move up in price.
Data reflects MLS records as of June 1, 2026. MLS figures may update as late transactions are recorded.
Key Takeaways
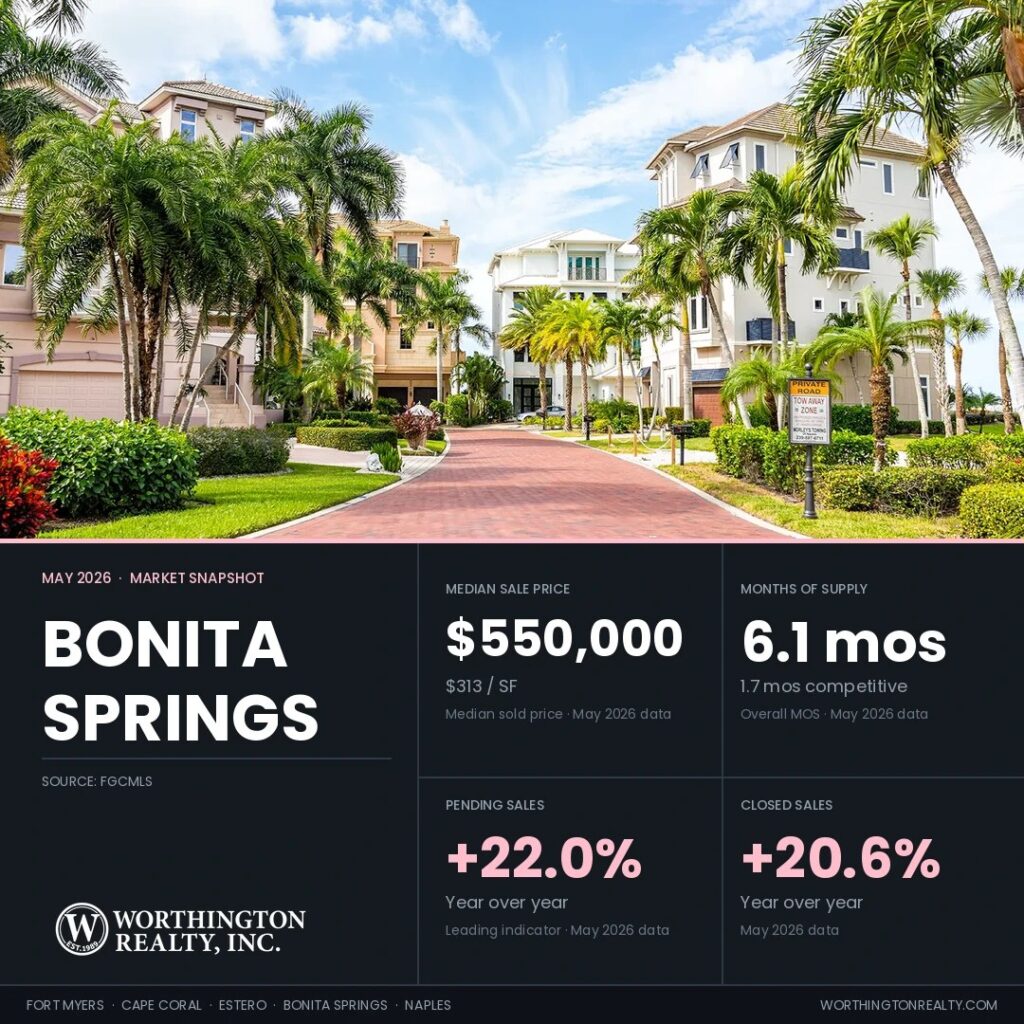
- Bonita Springs ended May with 958 active homes, but the smaller inventory pool did not erase price sensitivity, especially above $750K.
- Months of supply fell from 10.8 to 6.1, a 43.5% year-over-year drop, the steepest in the region.
- Closed sales reached 199, up 20.6% year over year, the eleventh consecutive month of year-over-year growth. Three-month rolling closings are up 23.0%.
- The relist dollar gap is $74,900, the widest percentage gap in the region at 13.3% below original ask, second to Naples on absolute dollars.
- Homes took a median of 72 days to sell in May, the longest in the region, though the three-month rolling figure of 65 days shows the selling pace holding steady rather than slowing.
- Bonita Springs has 6.1 MLS months of supply, but only about seven weeks (1.7 months) of competitive supply. Competitive supply sets aside stale listings, older active listings, and returning listings without a meaningful price reduction, leaving the homes most likely to compete for buyers right now.
Regional Snapshot at a Glance
Here is how Bonita Springs compares with the other Southwest Florida cities Worthington tracks.
| City | Median Sold Price | Median YoY | Price/SF | Price/SF YoY | Active Listings | Active YoY | Months of Supply | Months Supply YoY | Sold-to-List | Closed Sales | Closed YoY |
|---|---|---|---|---|---|---|---|---|---|---|---|
| Fort Myers | $335,000 | -8.3% | $201 | -9.0% | 2,986 | -25.0% | 6.4 | -34.7% | 96% | 503 | +0.8% |
| Cape Coral | $370,000 | +2.8% | $217 | -0.5% | 2,759 | -28.4% | 5.5 | -36.0% | 98% | 505 | -13.4% |
| Estero | $499,450 | -3.0% | $258 | -3.0% | 586 | -27.7% | 4.7 | -42.7% | 96% | 156 | +9.1% |
| Bonita Springs | $550,000 | 0.0% | $313 | -0.9% | 958 | -28.7% | 6.1 | -43.5% | 95% | 199 | +20.6% |
| Naples | $620,000 | +1.1% | $341 | +0.9% | 5,164 | -21.2% | 7.0 | -34.6% | 95% | 821 | +9.3% |
| Southwest Florida | $405,000 | +1.2% | $240 | -0.8% | 18,198 | -22.0% | 6.7 | -32.3% | 96% | 3,004 | -0.3% |
Source: FGCMLS via Stellar MLS. Single-month data unless otherwise noted. Southwest Florida reflects the entire Florida Gulf Coast MLS and is broader than the five featured cities combined. Bonita Springs three-month rolling median sale price is $565,000 and three-month rolling PPSF is $311.
Demand Continues at a Strong Pace on the Three-Month Trailing Read
Bonita’s single-month numbers rose sharply in May, but the three-month trend is the more reliable signal because a few higher-end closings can move the monthly data in this market.
Bonita Springs recorded 199 closed sales in May, up 20.6% from May 2025, the eleventh consecutive month of year-over-year growth. The trailing three-month closed-sales total of 675 is up 23.0% year over year. Pending sales totaled 150 new contracts in May, up 22.0% from a year ago. The trailing three-month pending total of 595 is up 20.7% year over year. Bonita’s snapshot Pending-to-Active Ratio was 22.0% (all currently pending homes against active listings, not just May’s new contracts), below the five-city snapshot average of 25.5%. Bonita closings outpaced new pending contracts in May (199 closed vs. 150 new pending), consistent with Estero and Naples and opposite the Fort Myers and Cape Coral pattern.
New listings totaled 157 in May, down 22.3% from 202 a year ago, the steepest decline in the region. Some of those listings are homes coming back after a previous listing attempt under a new MLS number. We identify those by matching addresses against expired, withdrawn, and terminated listings from the trailing 12 months.
Inventory Fell 28.7% Year Over Year, the Largest Drop in the Region
May ended with an active inventory of 958 homes, down 28.7% from 1,343 a year ago. That is the largest year-over-year inventory decline among the five cities. Roughly 900 to 1,000 Bonita Springs listings expired, were terminated, or were withdrawn from the market over the past 12 months without returning to the market. We refer to this as Shadow Inventory. Shadow Inventory does not mean these homes are guaranteed to come back. It simply shows how many sellers recently tried to sell, stopped, and have not yet returned. Lee County lis pendens filings add a separate public-records read on owner pressure. They sit above the pre-COVID baseline through 2025 and into 2026, though they remain far below 2008-era levels.
Showings per listing reached 2.7 in May, up 12.5% from 2.4 a year ago. The figure slipped from 3.1 in April, making Bonita Springs one of two cities, along with Naples, where showings per listing declined month over month. The median home now receives 11 showings before going under contract, up from 7 a year ago and up sharply from 8.5 in April. Buyers are touring more homes per purchase, particularly as rates climbed late in May.
The 30-year fixed-rate mortgage averaged 6.53% as of May 28, 2026, per Freddie Mac. That is up from 6.30% a month earlier and down from 6.89% a year earlier. At May’s $550,000 median sale price and 6.53%, a 20%-down conventional loan produces about $2,790 in monthly principal and interest. Property taxes, insurance, and HOA dues are additional.
Three-Month Rolling Reads Stabilize the Single-Month Volatility
Price per square foot (PPSF) normalizes for home size and is a cleaner read on home value than the median price. In Bonita Springs, with monthly closing volume in the 175 to 225 range, the three-month rolling figures are the most stable read on underlying price trends.
Bonita Springs’s three-month rolling median sale price is $565,000, down 0.9% from $570,000 a year ago and down 1.7% from $575,000 in April 2026. The single-month May figure was $550,000, flat against May 2025 and down 4.3% from April’s $575,000. We use the three-month number for Bonita because one high-end closing can make a smaller market look stronger or weaker for a single month.
Bonita Springs’s three-month rolling PPSF is $311, down 3.7% from $323 a year ago and essentially flat against $310 in April. The single-month May PPSF was $313. PPSF on the rolling basis has held within a $304 to $319 band across the past 12 months. The most recent four months have run in the $309 to $314 range.
The three-month rolling median DOM is 65 days, flat versus April and up modestly from 60 a year ago. May’s single-month DOM was 72, a one-month uptick that the rolling figure does not confirm as a trend. Rolling DOM shows the metric holding steady rather than the deterioration the single-month figure would suggest.
Dollar Volume, Sold-to-List Ratio, and Price Reductions
Single-month dollar volume reached $189.6 million in May, up 34.1% year over year, the largest single-month dollar-volume gain in the region. Dollar volume measures the total value of all homes sold, not the value of one typical home. More of the homes that closed in Bonita this month were higher-priced homes, which pushed total dollar volume higher. The median home value did not rise by 34%.
The May sold-to-list ratio reached 95%, essentially unchanged from a year ago. Sellers received about 95% of their most recent asking price at the closing table, so the final price landed roughly 5% below list. The gap between original asking price and final sale price is substantially wider on relisted homes (see the Relist Cost Analysis below).
Price reductions have been recorded on roughly 40% to 45% of currently listed Bonita Springs homes, similar to last month. When those reductions still don’t generate offers, listings often expire and return later as relists.
The Relist Cost Analysis Shows $74,900 Below Original Ask
The relist rate measures what share of currently listed homes have already failed to sell at least once in the past 12 months. It shows how much of today’s active inventory has already been through the market before.
Of the 926 Bonita Springs active listings in the address-matched analysis set, 233 (25.2%) have a prior listing in the trailing 12 months at the same address. Of those 233 returning listings, 176 came back with a price reduction of 3% or more from their previous attempt. Those are eligible for Competitive Inventory if they are also under 90 days into the current attempt. The remaining 57 returned at the same price or with a reduction under 3%, so they do not count as competitive supply.
Relisted Homes Sold $74,900 Below Original Ask After 4.5× the Market Time
The relist dollar gap is the difference between what sellers originally asked and what they eventually accepted after a previous listing attempt. Across the past 4 months, relisted Bonita Springs homes that sold closed a median of 13.3% below their original asking price, a median shortfall of $74,900. The 13.3% percentage gap is the widest in the region, and the $74,900 dollar gap is the second-largest behind Naples ($85,000), reflecting Naples’s higher absolute price points.
Combined across all listing attempts, these homes spent a median of 272 days on the market before closing. First-attempt sales cleared in 61 days. The relist process takes about 4.5 times longer to find a buyer than starting at a price recent sales support. The delay does not come from the final price alone. It comes from the time lost before the price reached the market, plus the reduced attention a listing gets after buyers have already seen it sit.
Bonita Springs has the widest percentage gap in the region for two reasons. First, active asking prices in specific price ranges sit well above where comparable homes have recently sold (documented below). Second, the city’s mid-to-upper price points produce dollar gaps that show up clearly as percentages even on disciplined relist adjustments. The 57 returning listings without a price reduction concentrate in higher-priced single-family homes, where asking prices remain farther from recent comparable sales. Buyers above $1.5M are more likely to find negotiating room on listings that returned without a price reduction.
Competitive Inventory Shows Bonita Springs Supply at 1.7 Months
You will see more than one supply number in this report. The MLS months of supply uses a 12-month sales pace and shows the broad market. The competitive figures below use the most recent three-month pace, which tracks current demand more closely and shows what a well-priced seller is more likely to face. Competitive Inventory sets aside stale listings, older active listings, and returning listings that came back without a meaningful price reduction. The result reflects the supply that is actively competing for buyers right now.
Three-part breakdown for Bonita Springs:
- All active listings at the recent 3-month sales pace: 4.1 months (the MLS months of supply of 6.1 uses a slower 12-month pace)
- Stale-stripped months of supply: 3.2 (after removing 206 listings at 180-plus days on market without a meaningful reduction)
- Competitive Months of Supply: 1.7 (after additionally removing returning listings without a meaningful price reduction and listings 90 to 179 days old, for a resulting count of 380 listings under 90 days that are first-attempt or meaningful relists)
Bonita’s Asking-Price Gap Is Widest Above $750K
Price sensitivity has held even as inventory dropped. Buyers still compare active listings to recent closings, especially above $750K. Bonita Springs’s active asking PPSF runs 15.3% above the recent sold PPSF overall, the widest spread in the region. This compares the median PPSF of homes currently for sale ($358) to the median PPSF of homes that closed over the past 4 months ($310). Sellers are asking more per square foot than buyers have recently been willing to pay, especially at higher price points. This is a market-level comparison and does not appraise any specific home. Active asks are a snapshot of what sellers want right now, while sold PPSF reflects what buyers paid over the last 4 months.
Under $400K, the spread is 13.8%. The $400K to $750K range comes in at 8.9%, and $750K to $1.5M at 17.7%. From $1.5M to $3M, the spread reaches 30.0%, and above $3M it sits at 25.2%.
Bonita is the only city in the region with an asking-price gap across multiple price ranges, with spreads above 8% in every range. The $400K to $750K range at 8.9% is the segment most closely aligned with recent sales, and the spreads above 17% in the upper three ranges are the widest within-range readings of any city.
Insurance context note: Florida’s homeowners insurance environment affects both sides of the deal. It can influence why some owners decide to sell, and it can change a buyer’s total cost enough to affect whether a contract still works. Bonita Springs’s flood exposure along the Imperial River, Bonita Bay, and Bonita Beach can produce coverage cost swings big enough to change a buyer’s annual cost of ownership.
Worthington Realty Market Lens
The metrics below come from address-level analysis across all five cities. Bonita Springs’s row is highlighted.
| City | Competitive Months of Supply | Relist Rate | Ask-Bid Gap (PPSF%) | Pending-to-Active Ratio | First-Attempt Median DOM | Relist Combined Median DOM |
|---|---|---|---|---|---|---|
| Fort Myers | 2.2 | 26.6% | 5.7% | 23.8% | 56 | 258 |
| Cape Coral | 2.3 | 22.8% | 13.7% | 30.1% | 49 | 246 |
| Estero | 1.4 | 21.7% | 4.4% | 30.1% | 61 | 268 |
| Bonita Springs | 1.7 | 25.2% | 15.3% | 22.0% | 61 | 272 |
| Naples | 2.1 | 24.4% | 12.0% | 24.1% | 57 | 260 |
Source: FGCMLS via Stellar MLS. Full definitions for each metric are in Worthington’s market methodology. Worthington’s address-level metrics come from a property-level MLS export, a separate dataset from the published monthly counts used for the headline figures, so the active total can differ slightly.
Closed Comparables Are Setting the Pace in Bonita Springs Featured Communities
The six Bonita Springs communities highlighted below span the city’s range of home types from Marbella at Spanish Wells coach homes at $429,000 to Pelican Landing’s Longlake closings at $1,237,500. The community-level data shows how differently the high-end gated communities and the 55-plus communities are clearing this cycle. Pending-to-active ratios run from 20.6% at Pelican Landing to 91.7% at Village Walk.
Arrows show month-over-month change versus the May 2026 cycle. Count and price metrics show percent change. Ratio and inventory metrics show point (pts) or month (mos) change.
Spanish Wells Golf and Country Club
- Active Listings: 36 (↓ 16.3% MoM)
- Sold (Last 120 Days): 32 (↑ 3.2% MoM)
- Homes Pending: 9 (↑ 12.5% MoM)
- Pending-to-Active Ratio: 25.0% (↑ 6.4 pts MoM)
- Previously Listed Share of Active: 16.7% (↓ 1.9 pts MoM)
- Months of Inventory: 4.5 (↓ 1.0 mos MoM)
- Median Sold Price: $625,000 (↓ 2.3% MoM)
- Sellers Received: 97.1% of asking price (↑ 0.3 pts MoM)
Active inventory fell 16.3% from May to 36 against 32 closings, pulling months of supply down 1.0 to 4.5. The seven-tier membership structure and the range of home types spread values widely across the community. The main Spanish Wells single-family homes closed 13 at an $875,000 median in 39 days, while Marbella closed 10 at $429,000 in 18 days, Las Brisas 5 at $310,000, and Cordova 3 at $900,000. The active pool mirrors that range, with 13 Marbella listings asking $429,000, 13 main Spanish Wells listings at $849,000, and Las Brisas near $339,000. The relist share eased to 16.7%. Sellers received 97.1% of asking, and closings cleared in a median 26 days. Buyers should anchor to comps within their home type and membership level, since a Marbella attached home and a main Spanish Wells single-family home occupy entirely different price points.
Search Spanish Wells homes for sale
Bonita National Golf and Country Club
- Active Listings: 35 (↓ 20.5% MoM)
- Sold (Last 120 Days): 49 (↑ 19.5% MoM)
- Homes Pending: 14 (↓ 6.7% MoM)
- Pending-to-Active Ratio: 40.0% (↑ 5.9 pts MoM)
- Previously Listed Share of Active: 14.3% (↓ 3.9 pts MoM)
- Months of Inventory: 2.9 (↓ 1.4 mos MoM)
- Median Sold Price: $750,000 (→ MoM)
- Sellers Received: 96.6% of asking price (→ MoM)
Closings rose 19.5% from May to 49 while active inventory fell 20.5% to 35, pulling months of supply down 1.4 to 2.9. Bonita National reports as a single development, so the price story sits in the spread between asking and recent sales, complicated by membership. The 49 closings settled at a $750,000 median in 47 days, while the 35 active listings ask a $629,000 median, below the closed median, which indicates the available inventory leans toward condos and coach homes. Because golf membership is bundled on some units and social-only on others, that asking-to-closing spread also combines two membership tiers, and a buyer must confirm which membership conveys before comparing prices. The relist share eased to 14.3%. Sellers should make the membership type explicit in their listing, since it directly affects which recent closing a buyer applies as a comp.
Search Bonita National homes for sale
Pelican Landing
- Active Listings: 34 (↓ 20.9% MoM)
- Sold (Last 120 Days): 73 (↑ 7.4% MoM)
- Homes Pending: 7 (↓ 41.7% MoM)
- Pending-to-Active Ratio: 20.6% (↓ 7.3 pts MoM)
- Previously Listed Share of Active: 32.4% (↑ 2.2 pts MoM)
- Months of Inventory: 1.9 (↓ 0.6 mos MoM)
- Median Sold Price: $600,000 (→ MoM)
- Sellers Received: 95.6% of asking price (↓ 0.4 pts MoM)
Active inventory fell 21% from May to 34 against 73 closings in Pelican Landing proper, bringing months of supply to 1.9 with the relist share at 32.4%, above the caution threshold. The community proper spans a wide range. Longlake closed 8 at a $1,237,500 median in 23 days at the high end, while Southbridge closed 6 at $436,000 and Cypress Island 4 at $460,000 lower down, with Costa Del Sol, Lakemont Cove, and Palm Colony in between. The Colony at Pelican Landing trades as a separate tier, closing 35 homes at a $2,020,000 median, so buyers should treat it as its own market rather than part of the community figure. The proper active pool asks a $582,000 median, with Southbridge near $542,000 and higher-end Lakemont and Sanctuary listings above $1,000,000. Buyers shopping Pelican Landing proper should price negotiations to the sub-$700,000 neighborhoods, not the Colony or Longlake figures.
Search Pelican Landing homes for sale
Seasons at Bonita
- Active Listings: 14 (↓ 6.7% MoM)
- Sold (Last 120 Days): 16 (↑ 23.1% MoM)
- Homes Pending: 6 (→ MoM)
- Pending-to-Active Ratio: 42.9% (↑ 2.9 pts MoM)
- Previously Listed Share of Active: 50.0% (↓ 3.3 pts MoM)
- Months of Inventory: 3.5 (↓ 1.1 mos MoM)
- Median Sold Price: $582,000 (↓ 7.6% MoM)
- Sellers Received: 96.5% of asking price (→ MoM)
Closings rose 23% from May to 16, a modest sample, so the $582,000 median should be read alongside comps for your specific floor plan. Active inventory eased to 14 and months of supply dropped 1.1 to 3.5. Seasons reports as a single D.R. Horton development, so the price story sits in the asking-to-closing spread. The 16 closings settled at a $582,000 median in 52 days, while the 14 active listings ask a $622,000 median, above recent sales, and the median itself fell 7.6% from May as the closing mix shifted. The relist share stands at 50% of active supply, with those returning sellers cutting about 12.7% before relisting, a steep adjustment. Buyers should pay close attention to listings that have already been reduced, where sellers have shown they will move on price, and reference recent closings rather than the higher active asking range.
Search Seasons at Bonita homes for sale
Valencia Bonita
- Active Listings: 21 (↑ 5.0% MoM)
- Sold (Last 120 Days): 26 (↑ 4.0% MoM)
- Homes Pending: 8 (↓ 20.0% MoM)
- Pending-to-Active Ratio: 38.1% (↓ 11.9 pts MoM)
- Previously Listed Share of Active: 38.1% (↓ 1.9 pts MoM)
- Months of Inventory: 3.2 (→ MoM)
- Median Sold Price: $812,500 (→ MoM)
- Sellers Received: 95.4% of asking price (↓ 0.1 pts MoM)
Active inventory rose 5.0% from May to 21 against 26 closings, with the pending-to-active ratio easing 12 points to 38.1% and 3.2 months of inventory. Valencia Bonita reports as a single 55-plus development, so the price story sits in the asking-to-closing spread. The 26 closings settled at an $812,500 median in 77 days, while the 21 active listings ask a $725,000 median, below the closed median, which indicates the available inventory leans toward the attached villas rather than the larger single-family homes that recently closed. The relist share is 38.1%, above the caution threshold, with those returning sellers trimming about 5.0% before coming back. Buyers should focus on listings carrying longer market time, where sellers are more likely to negotiate, and reference recent closings within the specific home type, villa or single-family, they are considering.
Search Valencia Bonita homes for sale
Village Walk of Bonita Springs
- Active Listings: 12 (↓ 40.0% MoM)
- Sold (Last 120 Days): 37 (↑ 27.6% MoM)
- Homes Pending: 11 (↓ 21.4% MoM)
- Pending-to-Active Ratio: 91.7% (↑ 21.7 pts MoM)
- Previously Listed Share of Active: 8.3% (↓ 1.7 pts MoM)
- Months of Inventory: 1.3 (↓ 1.5 mos MoM)
- Median Sold Price: $527,500 (↑ 9.9% MoM)
- Sellers Received: 96.9% of asking price (→ MoM)
Active inventory fell 40% from May to 12 while closings rose 28% to 37, pushing the pending-to-active ratio up 22 points to 91.7% and months of supply down 1.5 to 1.3. Village Walk reports as a single DiVosta development, so the price story sits in the asking-to-closing spread. The 37 closings settled at a $527,500 median in 30 days, while the 12 active listings ask a $483,500 median, below the closed median, and the median itself rose 9.9% from May. Only one active listing has been on the market before, an 8.3% relist share. Sellers received 96.9% of asking. With pending demand nearly matching the entire active pool and inventory down to 1.3 months, sellers of correctly priced homes in this walkable, no-CDD community are finding contracts quickly and can list to recent closings.
Search Village Walk of Bonita Springs homes for sale
Frequently Asked Questions
Bonita’s inventory fell 28.7% year over year, the largest decline in Southwest Florida, and months of supply fell 43.5%. The active-vs-sold PPSF spread runs 15.3% and the relist gap sits 13.3% below original ask, concentrated above $750K. Asking prices from $400K to $750K line up with recent sales, while homes under $400K and above $750K run higher, leaving more room to negotiate.
The May sold-to-list ratio came in at 95%, meaning the median home sold for about 5% below its most recent listed price. The median relisted home sold at $74,900 (13.3%) below original ask after roughly 9 months of combined market exposure. Asking prices above $1.5M run 25% to 30% above recent closed sales, leaving the most room to negotiate.
The wider overall spread reflects active asking prices set well above recent sold prices across multiple price ranges, particularly above $750K where spreads run 17.7% to 30.0%. The $400K to $750K range at 8.9% is the segment most closely aligned with recent sales.
First-attempt listings priced close to recent sales sold in a median of 61 days. The three-month rolling DOM is 65 days, essentially flat against April. Relisted homes that sold took 272 days combined across all attempts, 4.5 times longer than first-attempt sales.
Bonita has the second-longest closing-growth streak in Southwest Florida at eleven consecutive months, behind Naples. Months of supply fell 43.5%. The active-vs-sold PPSF spread runs 15.3% overall and the relist gap sits 13.3% below original ask.
Track the Bonita Springs Market in Real Time
Create a free account to save searches and receive alerts on new listings, price reductions, and status changes for the homes you’re watching.
The Bottom Line for Bonita Springs
Bonita Springs ended May with its closing-growth streak at eleven consecutive months. Dollar volume rose 34.1% year over year, the largest percentage increase in the region, and months of supply fell 43.5%. Active asking PPSF runs 15.3% above recent closed sales overall, concentrated above $750K where active asks run 17.7% to 30.0% above recent closed sales.
What Buyers and Sellers Should Take From May
Negotiating room varies sharply by price range. Homes from $400K to $750K are closely aligned with recent sales. Homes above $750K offer real negotiating room, especially in the $1.5M to $3M range where the spread reaches 30.0%. Sellers who reach too far above recent comps pay for it in time and final price. Homes priced within the recent comparable range are finding buyers in 61 days, while homes that start well above it spend roughly 4.5 times longer on the market before selling about $74,900 below their original ask.
The Worthington team works with buyers and sellers across Bonita Springs neighborhoods every week. That includes Spanish Wells Golf and Country Club, Pelican Landing, Valencia Bonita, Village Walk, and the broader Bonita Springs area. The numbers show where pricing turns unforgiving above $750K. Pricing a specific Bonita Springs home against that is what we do alongside our clients.
Schedule a 15-minute conversation to discuss your situation →
All data referenced in Worthington’s market reports draws from the Florida Gulf Coast MLS (FGCMLS via Stellar MLS) unless otherwise noted.
May 2026 Southwest Florida Housing Market Report Series
- Southwest Florida Months of Supply Falls to 6.7 in May
- Fort Myers Has the Highest Relist Rate in Southwest Florida
- Cape Coral Pending Sales Rose 18.8% Year Over Year
- Estero Ask-Bid Gap Is the Tightest in Southwest Florida
- Naples Closed Sales Grew for the 12th Month in a Row
Worthington MLS Search by City
Fort Myers | Cape Coral | Estero | Bonita Springs | Naples
For a full explanation of the indicators used in this report, see how Worthington Realty analyzes the Southwest Florida housing market.