

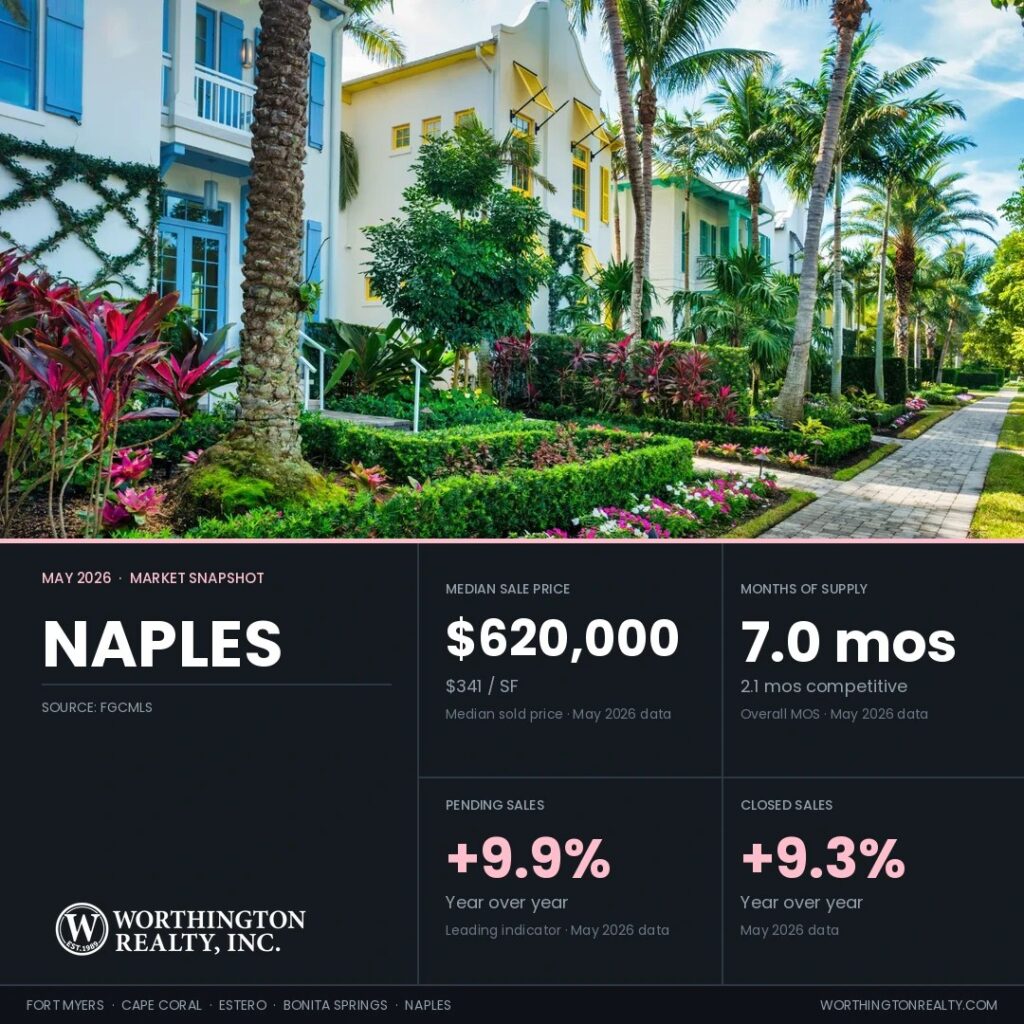
Naples Closed Sales Grew 9.3% in May, the 12th Consecutive Month of Year-Over-Year Growth
Naples closed sales keep climbing, with May marking a full year of year-over-year growth. What that growth means for a buyer or seller depends on price range.
From $400K to $750K, asking prices sit within 3.6% of recent sales, so there is little room to negotiate. Above $3M, they run 15.0% higher, giving buyers more room to negotiate. For sellers, the approach is the same at any price: price to what is actually selling. That discipline matters most above $3M, where asking prices have drifted furthest from recent sales.
Data reflects MLS records as of June 1, 2026. MLS figures may update as late transactions are recorded.
Key Takeaways
- Naples pending sales rose 9.9% to 787 new contracts, pointing to steady buyer demand behind a twelfth straight month of closing growth.
- Dollar volume reached $1.00 billion in May, up 20.7% year over year, the only single-city billion-dollar figure in the region.
- The relist dollar gap is $85,000, the largest in the region in absolute dollars. Relisted homes sold 12.3% below their original asking price after a combined median of 260 days on market, versus 57 days for first-attempt sales.
- Active inventory fell to 5,164, down 21.2% year over year, with months of supply dropping from 10.7 to 7.0.
- The Naples market splits by price range. The $400K to $750K segment shows the tightest pricing within Naples at 3.6%, while above $3M sellers run 15.0% above recent sold prices.
Regional Snapshot at a Glance
Here is how Naples compares with the other Southwest Florida cities Worthington tracks.
| City | Median Sold Price | Median YoY | Price/SF | Price/SF YoY | Active Listings | Active YoY | Months of Supply | Months Supply YoY | Sold-to-List | Closed Sales | Closed YoY |
|---|---|---|---|---|---|---|---|---|---|---|---|
| Fort Myers | $335,000 | -8.3% | $201 | -9.0% | 2,986 | -25.0% | 6.4 | -34.7% | 96% | 503 | +0.8% |
| Cape Coral | $370,000 | +2.8% | $217 | -0.5% | 2,759 | -28.4% | 5.5 | -36.0% | 98% | 505 | -13.4% |
| Estero | $499,450 | -3.0% | $258 | -3.0% | 586 | -27.7% | 4.7 | -42.7% | 96% | 156 | +9.1% |
| Bonita Springs | $550,000 | 0.0% | $313 | -0.9% | 958 | -28.7% | 6.1 | -43.5% | 95% | 199 | +20.6% |
| Naples | $620,000 | +1.1% | $341 | +0.9% | 5,164 | -21.2% | 7.0 | -34.6% | 95% | 821 | +9.3% |
| Southwest Florida | $405,000 | +1.2% | $240 | –0.8% | 18,198 | -22.0% | 6.7 | -32.3% | 96% | 3,004 | -0.3% |
Source: FGCMLS via Stellar MLS. Single-month data unless otherwise noted. Southwest Florida reflects the entire Florida Gulf Coast MLS and is broader than the five featured cities combined.
Naples Closings Rose for a Twelfth Straight Month
The Naples market has enough monthly volume to read the single-month data more directly, though closing-price mix still matters because the upper end can move dollar volume quickly.
Naples recorded 821 closed sales in May, up 9.3% over the same month last year. Closings have grown year over year for twelve consecutive months dating back to June 2025, the longest active streak among the five Southwest Florida cities.
Pending sales reached 787 new contracts in May, up 9.9% from a year ago. The snapshot Pending-to-Active Ratio (all currently pending homes against active listings, not just May’s new contracts) sits at 24.1%, slightly below the five-city snapshot average of 25.5%. Naples closings outpaced new pending contracts in May (821 closed vs. 787 new pending), consistent with Bonita Springs and Estero.
New listings totaled 911 in May, down 1.3% from 923 a year ago, one of the lightest declines in the region. Naples is the only city in the region besides Estero where new listings did not drop more than 18% year over year. The headline figure still includes homes returning to market under new MLS numbers after a previous listing attempt. That share is consistent with the city’s 24.4% relist rate on current active listings.
Inventory Dropped 21.2% as Showings Climbed 14.8%
May ended with an active inventory of 5,164 homes, down 21.2% from 6,552 a year ago. Naples holds the largest absolute active inventory in the region by a wide margin, reflecting the size of the Naples market relative to the other four cities. Roughly 4,400 to 4,500 Naples listings expired, were terminated, or were withdrawn from the market over the past 12 months without returning to the market. We refer to this as Shadow Inventory. Shadow Inventory does not mean these homes are guaranteed to come back. It simply shows how many sellers recently tried to sell, stopped, and have not yet returned. The Naples figure is the largest in the region.
Showings per listing reached 3.1 in May, up 14.8% from 2.7 a year ago. The figure slipped from 3.5 in April month over month, consistent with the rate environment late in May. The median home now goes under contract after 10 showings, up from 8 a year ago and up from 9 in April.
The 30-year fixed-rate mortgage averaged 6.53% as of May 28, 2026, per Freddie Mac. That is up from 6.30% a month earlier and down from 6.89% a year ago. At May’s $620,000 median sale price and 6.53%, a 20%-down conventional loan produces about $3,145 in monthly principal and interest. Property taxes, insurance, and HOA dues are additional. Because Naples has a larger upper-end segment than the other four cities, mortgage rate moves may affect a smaller share of buyers here than in Fort Myers or Cape Coral.
Median Sale Price Eased as High-End Sales Settled Back
Price per square foot (PPSF) normalizes for home size. The median sale price moves when the mix of homes closing in a given month changes, even when underlying prices do not. In Naples, where the upper end can move dollar volume quickly, PPSF is the cleaner read on whether values are actually shifting.
Naples median sale price came in at $620,000 in May, up 1.1% from $613,000 a year ago and down 3.9% from $645,000 in April 2026. Median PPSF was $341, up 0.9% year over year and down 2.6% from $350 in April. The single-month moderation from April reflects the share of $1.5M-plus closings normalizing after April’s higher share. PPSF year-over-year is positive, indicating per-square-foot values remain stable despite the headline median variation. PPSF has held within $326 to $350 across the past five months.
Dollar Volume Reached $1.00 Billion, Up 20.7% Year Over Year
Dollar volume reached $1.00 billion in May, up 20.7% year over year. Naples produced the only single-city billion-dollar figure in the region in May. Closings rose 9.3% and dollar volume rose 20.7%, meaning the average sale price climbed sharply versus May 2025. The dollar volume growth reflects both the closing volume gain and more higher-priced homes closing despite the modest single-month moderation in the median. That does not mean the typical Naples home rose 20.7%. It means the total value of May closings increased.
The May sold-to-list ratio reached 95%, essentially unchanged from a year ago. Sellers received about 95% of their most recent asking price at the closing table, so the final price landed roughly 5% below list. The gap between original asking price and final sale price is substantially wider on relisted homes (see the Relist Cost Analysis below).
Price reductions have been recorded on roughly 40% to 45% of currently listed Naples homes, similar to last month. When those reductions still don’t generate offers, listings often expire and return later as relists.
The Relist Cost Analysis Now Leads the Region at $85,000
The relist rate measures what share of currently listed homes have already failed to sell at least once in the past 12 months. It shows how much of today’s active inventory has already been through the market before.
Of the 5,012 Naples active listings in the address-matched analysis set, 1,222 (24.4%) have a prior listing in the trailing 12 months at the same address. Of those 1,222 returning listings, 830 came back with a price reduction of 3% or more from their previous attempt. Those are eligible for Competitive Inventory if they are also under 90 days into the current attempt. The remaining 392 returned at the same price or with a reduction under 3%, so they do not count as competitive supply.
Relisted Homes Sold $85,000 Below Original Ask After 4.6× the Market Time
The relist dollar gap is the difference between what sellers originally asked and what they eventually accepted after a previous listing attempt. Across the past 4 months, relisted Naples homes that sold closed a median of 12.3% below their original asking price, a median shortfall of $85,000. At $85,000, this is the largest dollar gap in the region, now leading Bonita Springs ($74,900) and Estero ($54,900) on absolute dollars. Naples leads on the dollar gap because the city has the highest absolute price points in Southwest Florida. The same percentage gap converts to more dollars at Naples’s median price than at Cape Coral’s. On a percentage basis, Naples’s 12.3% sits behind Bonita Springs’s 13.3%.
The delay does not come from the final price alone. It comes from the time lost before the price reached the market, plus the reduced attention a listing gets after buyers have already seen it sit.
Combined across all listing attempts, relisted homes that sold spent a median of 260 days on the market before closing. First-attempt sales cleared in 57 days. The relist process takes about 4.6 times longer to find a buyer than starting at a price recent sales support.
The 392 returning listings without a price reduction in Naples concentrate above the $1.5M mark. These are sellers who have brought their homes back to market without adjusting the price from their previous attempt. Buyers above $1.5M should pay close attention to returning listings that came back without a price change.
Competitive Inventory Shows Naples Supply at 2.1 Months
You will see more than one supply number in this report. The MLS months of supply uses a 12-month sales pace and shows the broad market. The competitive figures below use the most recent three-month pace, which tracks current demand more closely and shows what a well-priced seller is more likely to face. Competitive Inventory sets aside stale listings, older active listings, and returning listings that came back without a meaningful price reduction. The result reflects the supply that is actively competing for buyers right now.
Three-part breakdown for Naples:
- All active listings at the recent 3-month sales pace: 5.2 months (the MLS months of supply of 7.0 uses a slower 12-month pace)
- Stale-stripped months of supply: 4.0 (after removing 1,185 listings at 180-plus days on market without a meaningful reduction)
- Competitive Months of Supply: 2.1 (after additionally removing returning listings without a meaningful price reduction and listings 90 to 179 days old, for a resulting count of 2,054 listings under 90 days that are first-attempt or meaningful relists)
Asking-Price Gaps Are Widest Above $3M
Naples’s active asking PPSF runs 12.0% above the recent sold PPSF overall. This compares the median PPSF of homes currently for sale ($380) to the median PPSF of homes that have closed over the past 4 months ($339). Sellers are asking more per square foot than buyers have recently been willing to pay, especially at higher price points. This is a market-level comparison and does not appraise any specific home.
Under $400K, the spread is 7.8%. The $400K to $750K range comes in at 3.6%, the tightest of Naples’s price ranges. From $750K to $1.5M, the spread is 6.9%. From $1.5M to $3M, the spread sits at 5.6%. Above $3M, it reaches 15.0%, where the misalignment concentrates.
Naples is sharply divided by price range. Mid-priced sellers from $400K to $750K are entering aligned with recent sold ranges. Above $3M, the active pool runs well above where the market has actually been clearing. The segment shows 634 active listings versus 279 closings over the past 4 months, a 2.3-to-1 ratio. Buyers above $3M are looking at the widest gap between active asking prices and recent sold prices, and sellers in that segment face the longest path to a buyer at current asks.
Insurance context note: Florida’s homeowners insurance environment affects both sides of the deal. It can influence why some owners decide to sell, and it can change a buyer’s total cost enough to affect whether a contract still works. Naples’s flood exposure includes Gulf-front, bay-front, and Cocohatchee River neighborhoods where coverage cost variation during the contract period can change a buyer’s annual cost of ownership.
Worthington Realty Market Lens
The metrics below come from address-level analysis across all five cities. Naples’s row is highlighted.
| City | Competitive Months of Supply | Relist Rate | Ask-Bid Gap (PPSF%) | Pending-to-Active Ratio | First-Attempt Median DOM | Relist Combined Median DOM |
|---|---|---|---|---|---|---|
| Fort Myers | 2.2 | 26.6% | 5.7% | 23.8% | 56 | 258 |
| Cape Coral | 2.3 | 22.8% | 13.7% | 30.1% | 49 | 246 |
| Estero | 1.4 | 21.7% | 4.4% | 30.1% | 61 | 268 |
| Bonita Springs | 1.7 | 25.2% | 15.3% | 22.0% | 61 | 272 |
| Naples | 2.1 | 24.4% | 12.0% | 24.1% | 57 | 260 |
Source: FGCMLS via Stellar MLS. Full definitions for each metric are in Worthington’s market methodology. Worthington’s address-level metrics come from a property-level MLS export, a separate dataset from the published monthly counts used for the headline figures, so the active total can differ slightly.
Closed Comparables Are Setting the Pace in Naples Featured Communities
The six Naples communities highlighted below span a wide absolute price range. Closings over the past 4 months ranged from Ole’s $397,500 condominium median at Lely Resort to Grey Oaks’ $6,000,000 Estates at Grey Oaks median. Months of supply across the six communities runs from 3.1 at Grey Oaks to 5.0 at Lely Resort and Pelican Bay, all below the citywide 5.4 figure.
Arrows show month-over-month change versus the May 2026 cycle. Count and price metrics show percent change. Ratio and inventory metrics show point (pts) or month (mos) change.
Lely Resort

- Active Listings: 128 (↓ 11.7% MoM)
- Sold (Last 120 Days): 102 (↑ 9.7% MoM)
- Homes Pending: 29 (↓ 9.4% MoM)
- Pending-to-Active Ratio: 22.7% (↑ 0.6 pts MoM)
- Previously Listed Share of Active: 22.7% (↓ 2.1 pts MoM)
- Months of Inventory: 5.0 (↓ 1.2 mos MoM)
- Median Sold Price: $747,500 (→ MoM)
- Sellers Received: 95.0% of asking price (↑ 0.5 pts MoM)
Active inventory fell 11.7% from May to 128 against 102 closings, pulling months of supply down 1.2 to 5.0 with the relist share at 22.7%. The community spans more than forty neighborhoods, so the $747,500 median covers a wide range. Ole closed 12 at a $397,500 median at the entry level, while Classics Plantation Estates closed 6 at $2,125,000, Majors 5 at $1,500,000, and Lakoya 5 at $1,350,000 at the top, with Players Cove and Lely Island Estates in between. The active pool concentrates heavily in Ole, where 30 listings ask a $394,000 median, alongside Greenlinks at $469,000 and higher-tier Lakoya at $1,750,000 and Classics at $2,122,500. Returning sellers cut about 10.9% before relisting. Buyers should anchor firmly to comps within their target neighborhood, since Ole and the Classics occupy opposite ends of the price range and the community-wide median fits neither.
Search Lely Resort homes for sale
The Vineyards
- Active Listings: 78 (↓ 10.3% MoM)
- Sold (Last 120 Days): 75 (↑ 15.4% MoM)
- Homes Pending: 16 (↓ 38.5% MoM)
- Pending-to-Active Ratio: 20.5% (↓ 9.4 pts MoM)
- Previously Listed Share of Active: 21.8% (↑ 2.3 pts MoM)
- Months of Inventory: 4.2 (↓ 1.2 mos MoM)
- Median Sold Price: $680,000 (↓ 17.1% MoM)
- Sellers Received: 95.0% of asking price (↓ 0.2 pts MoM)
Closings rose 15% from May to 75 while active inventory fell 10.3% to 78, pulling months of supply down 1.2 to 4.2, with the median down 17.1% as the closing mix shifted. Across 38 neighborhoods the range is wide. Tuscany closed 5 at a $295,000 median at the entry level, while Hammock Isles closed 6 at $1,680,000 and Tierra Lago 5 at $1,775,000 at the top, with Avellino Isles, Vista Pointe, and Regency Reserve in the middle. The active pool spans the same spread, from Bellerive near $359,000 to Valley Oak at $1,900,000, with the overall active median ask at $579,000. Returning sellers trimmed about 9.0%, and active listings carry a 111-day median on market against 65 days for closings. Sellers should price to recent closings within their own neighborhood, since listings that start high are sitting well past the closing pace.
Search The Vineyards homes for sale
Esplanade Golf and Country Club

- Active Listings: 31 (↓ 13.9% MoM)
- Sold (Last 120 Days): 29 (↑ 3.6% MoM)
- Homes Pending: 17 (↑ 13.3% MoM)
- Pending-to-Active Ratio: 54.8% (↑ 13.1 pts MoM)
- Previously Listed Share of Active: 22.6% (↑ 5.9 pts MoM)
- Months of Inventory: 4.3 (↓ 0.8 mos MoM)
- Median Sold Price: $1,600,000 (↓ 6.0% MoM)
- Sellers Received: 95.7% of asking price (↑ 0.2 pts MoM)
Active inventory fell 13.9% from May to 31 against 29 closings, with the pending-to-active ratio up 13 points to 54.8% and 4.3 months of inventory. Esplanade reports as a single development, and the asking-to-closing spread tells the clearest story. The 29 closings ran from $395,000 condos to $3,350,000 single-family homes and settled at a $1,600,000 median, but this 120-day window leaned toward larger homes. The 31 active listings ask a $799,000 median, far below that closed figure, which confirms the closed median overstates where a typical condo or villa trades and where most current inventory sits. The median fell 6.0% from May. The relist share is 22.6%. Buyers should anchor to comps within their specific home type rather than the $1,600,000 community-wide median, which the recent sales mix pulled upward and which the active asking range does not support.
Search Esplanade Golf and Country Club homes for sale
Isles of Collier Preserve

- Active Listings: 62 (↓ 15.1% MoM)
- Sold (Last 120 Days): 62 (↑ 17.0% MoM)
- Homes Pending: 20 (↓ 25.9% MoM)
- Pending-to-Active Ratio: 32.3% (↓ 4.7 pts MoM)
- Previously Listed Share of Active: 30.6% (↑ 0.5 pts MoM)
- Months of Inventory: 4.0 (↓ 1.5 mos MoM)
- Median Sold Price: $1,252,500 (↓ 16.2% MoM)
- Sellers Received: 96.0% of asking price (→ MoM)
Closings rose 17% from May to 62 while active inventory fell 15.1% to 62, pulling months of supply down 1.5 to 4.0, with the median down 16.2% as the closing mix shifted. Isles of Collier Preserve reports as a single Minto development, so the price story sits in the asking-to-closing spread. The 62 closings settled at a $1,252,500 median in 36 days, while the 62 active listings ask a $987,000 median, below the closed median, which indicates the available inventory leans toward the villas and coach homes. The relist share is 30.6%, above the caution threshold, with returning sellers cutting about 10.7% before relisting. Buyers should give particular attention to relisted homes, where sellers have already shown willingness to adjust, and reference recent closings within the specific home type they are considering rather than the community-wide median.
Search Isles of Collier Preserve homes for sale
Pelican Bay
- Active Listings: 183 (↓ 13.7% MoM)
- Sold (Last 120 Days): 145 (↑ 5.1% MoM)
- Homes Pending: 47 (↑ 9.3% MoM)
- Pending-to-Active Ratio: 25.7% (↑ 5.4 pts MoM)
- Previously Listed Share of Active: 18.0% (↓ 6.1 pts MoM)
- Months of Inventory: 5.0 (↓ 1.1 mos MoM)
- Median Sold Price: $1,650,000 (↑ 2.3% MoM)
- Sellers Received: 95.2% of asking price (↑ 0.6 pts MoM)
Active inventory fell 13.7% from May to 183 against 145 closings, pulling months of supply down 1.1 to 5.0 with the median up 2.3% to $1,650,000. The community spans Gulf-front high-rises, villa enclaves, and estate homes, so the median combines distinct markets. Crescent closed 11 at a $1,435,000 median, while Montenero closed 6 at $3,000,000, Marbella 4 at $3,212,500, and Oakmont 4 at $2,462,500 at the top, with Calais at $1,150,000 lower down. The active pool spans the same range, from Interlachen near $690,000 to Oakmont at $3,000,000, with the overall active median ask at $1,325,000. The relist share eased to 18.0%, and active listings carry a 116-day median on market. Sellers should price to recent closings within their specific building or enclave, since the deeper supply at 5.0 months rewards accurate pricing over the longer-standing asking range.
Search Pelican Bay homes for sale
Grey Oaks

- Active Listings: 17 (↑ 6.2% MoM)
- Sold (Last 120 Days): 22 (↑ 37.5% MoM)
- Homes Pending: 7 (↓ 50.0% MoM)
- Pending-to-Active Ratio: 41.2% (↓ 46.3 pts MoM)
- Previously Listed Share of Active: 23.5% (↑ 4.7 pts MoM)
- Months of Inventory: 3.1 (↓ 0.9 mos MoM)
- Median Sold Price: $4,330,000 (↑ 3.6% MoM)
- Sellers Received: 96.0% of asking price (↓ 0.7 pts MoM)
Closings rose to 22 from last cycle while active inventory edged up to 17, with the pending-to-active ratio easing to 41.2% on 3.1 months of inventory. At this price level a single transaction moves the figures, so the $4,330,000 median is best read alongside comps within your specific enclave. The Estates at Grey Oaks closed 7 at a $6,000,000 median in 27 days, while Venezia closed 3 at $3,850,000, Miramonte 2 at $5,367,500, and the Estuary 2 at $7,475,000, with Terra Verde lower at $1,900,000. The active pool spans the Estuary near $4,199,000 to the Estates at $5,624,500. The relist share is 23.5%, with returning sellers cutting about 5.8%. Buyers should evaluate comps within the specific enclave and price tier they are targeting, since the Estuary and Terra Verde occupy entirely different points within this luxury range.
Search Grey Oaks homes for sale
Frequently Asked Questions
Naples has the longest closing-growth streak in the region at twelve consecutive months. Active inventory dropped 21.2% year over year. The $400K to $750K segment shows the tightest active-vs-sold PPSF spread at 3.6%, while above $3M sellers ask 15.0% above recent sold prices, with 634 active listings against 279 closings in 4 months. Buyers above $3M have the most negotiating leverage.
The May sold-to-list ratio came in at 95%, about 5% below the most recent listed price. Relisted homes sold at a median of $85,000 (12.3%) below original ask after roughly 8.7 months on the market. The 392 returning listings without a price reduction concentrate above $1.5M and offer the most negotiating room.
The decline reflects a mix shift in the closing pool, not a value drop. PPSF was up 0.9% year over year and held within $326 to $350 across the past five months. April’s median included a higher share of $1.5M-plus closings. May’s mix returned to the city’s usual distribution. The 20.7% dollar volume gain confirms continued strength at the higher end.
First-attempt listings priced close to recent sales sold in a median of 57 days. Relisted homes that sold took 260 days combined, 4.6 times longer.
Naples holds the longest closing-growth streak in Southwest Florida at twelve months and the only single-city billion-dollar figure ($1.00 billion). Active inventory is the largest in the region at 5,164 homes, and the relist dollar gap is the largest in absolute dollars at $85,000.
Track the Naples Market in Real Time
Create a free account to save searches and receive alerts on new listings, price reductions, and status changes for the homes you’re watching.
The Bottom Line for Naples
Naples kept its sales-growth streak alive in May, now twelve consecutive months, the longest in the region. The city recorded the only single-city billion-dollar volume figure at $1.00 billion and the largest relist dollar gap in the region in absolute dollars at $85,000. The market looks very different by price range: mid-priced sellers from $400K to $750K are entering aligned with recent closed sales at a 3.6% spread, while above $3M active asks run 15.0% above recent sold prices.
What Buyers and Sellers Should Take From May
Buyers should look at Naples by price range. From $400K to $750K, asking prices sit close to recent sales, with limited negotiating room and tight competition for first-attempt listings. Above $1.5M, and especially above $3M, the 392 returning listings without a price reduction offer the most room to negotiate. For sellers, the 57-day first-attempt median is the benchmark, and pricing within the recent comparable range is what gets a home sold. The cost of pricing above recent closed sales is documented at $85,000 over 260 days of combined market exposure.
The Worthington team works with buyers and sellers across Naples neighborhoods every week. That includes Pelican Bay, Esplanade Golf and Country Club, Isles of Collier Preserve, Lely Resort, and the broader Naples area. The citywide numbers mean different things at different price points. Pinning down what they mean for a specific Naples home is what we do alongside our clients.
Schedule a 15-minute conversation to discuss your situation →
All data referenced in Worthington’s market reports draws from the Florida Gulf Coast MLS (FGCMLS via Stellar MLS) unless otherwise noted.
May 2026 Southwest Florida Housing Market Report Series
- Southwest Florida Months of Supply Falls to 6.7 in May
- Fort Myers Has the Highest Relist Rate in Southwest Florida
- Cape Coral Pending Sales Rose 18.8% Year Over Year
- Estero Ask-Bid Gap Is the Tightest in Southwest Florida
- Bonita Springs Inventory Fell 28.7% Year Over Year
Worthington MLS Search by City
Fort Myers | Cape Coral | Estero | Bonita Springs | Naples
For a full explanation of the indicators used in this report, see how Worthington Realty analyzes the Southwest Florida housing market.