

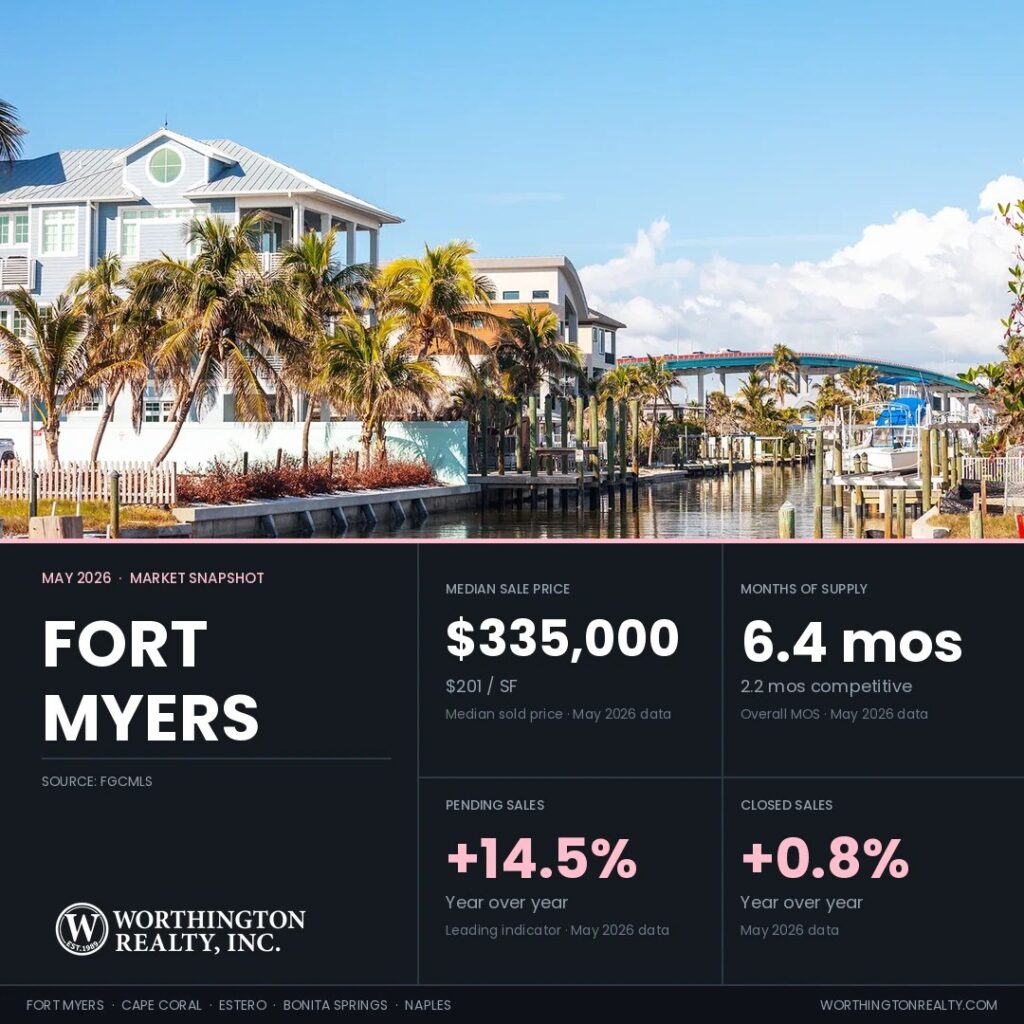
Fort Myers Relist Rate Reached 26.6% in May, the Highest in Southwest Florida
The Fort Myers relist rate hit 26.6% in May, the highest in Southwest Florida. That means 777 active listings, more than a quarter of the market, have already been through at least one prior listing attempt. When that many homes have already circled back, the launch price often separates the listings that sell from the ones that repeat the cycle.
Sellers who priced close to recent sales kept moving, with closings up for a ninth straight month. Listings that did not meet the market were more likely to come back. For buyers, those returning listings are one of the clearest places to look for negotiating room.
Data reflects MLS records as of June 1, 2026. MLS figures may update as late transactions are recorded.
Key Takeaways
- Relisted Fort Myers homes sold a median of $47,000 below original ask, 11.8% under their original asking price, after a combined median of 258 days on market versus 56 days for first-attempt sales.
- The 26.6% relist rate is the highest in Southwest Florida, the share of active listings that have already been on the market at least once.
- Closed sales reached 503 in May, up 0.8% year over year, the ninth consecutive month of year-over-year growth.
- Active inventory fell to 2,986, down 25.0% year over year, with months of supply dropping from 9.8 to 6.4.
- Fort Myers has 6.4 MLS months of supply, but about 10 weeks (2.2 months) of competitive supply. Competitive supply sets aside stale listings, older active listings, and returning listings without a meaningful price reduction, leaving the homes most likely to compete for buyers right now.
Regional Snapshot at a Glance
Here is how Fort Myers compares with the other Southwest Florida cities Worthington tracks.
| City | Median Sold Price | Median YoY | Price/SF | Price/SF YoY | Active Listings | Active YoY | Months Supply | MonthsSupply YoY | Sold-to-List | Closed Sales | Closed YoY |
|---|---|---|---|---|---|---|---|---|---|---|---|
| Fort Myers | $335,000 | -8.3% | $201 | -9.0% | 2,986 | -25.0% | 6.4 | -34.7% | 96% | 503 | +0.8% |
| Cape Coral | $370,000 | +2.8% | $217 | -0.5% | 2,759 | -28.4% | 5.5 | -36.0% | 98% | 505 | -13.4% |
| Estero | $499,450 | -3.0% | $258 | -3.0% | 586 | -27.7% | 4.7 | -42.7% | 96% | 156 | +9.1% |
| Bonita Springs | $550,000 | 0.0% | $313 | -0.9% | 958 | -28.7% | 6.1 | -43.5% | 95% | 199 | +20.6% |
| Naples | $620,000 | +1.1% | $341 | +0.9% | 5,164 | -21.2% | 7.0 | -34.6% | 95% | 821 | +9.3% |
| Southwest Florida | $405,000 | +1.2% | $240 | -0.8% | 18,198 | -22.0% | 6.7 | -32.3% | 96% | 3,004 | -0.3% |
Source: FGCMLS via Stellar MLS. Single-month data unless otherwise noted. Southwest Florida reflects the entire Florida Gulf Coast MLS and is broader than the five featured cities combined.
Fort Myers Closings Rose for a Ninth Straight Month
Closed sales show what made it to the closing table. Pending sales show whether buyer activity is still feeding the next month’s closings.
Fort Myers recorded 503 closed sales in May, up 0.8% over the same month last year. Closings have grown year over year for nine consecutive months dating back to September 2025, the second-longest active streak in the region after Naples.
Pending sales reached 506 new contracts in May, up 14.5% from a year ago. The snapshot Pending-to-Active Ratio (all currently pending homes against active listings, not just May’s new contracts) sits at 23.8%, slightly below the five-city snapshot average of 25.5%. Fort Myers and Cape Coral were the two cities in the region with more new pending contracts in May than May closings.
New listings totaled 622 in May, down 18.5% from a year ago. Some of those listings are homes coming back after a previous listing attempt under a new MLS number. We identify those by matching addresses against expired, withdrawn, and terminated listings from the trailing 12 months.
Inventory Dropped 25.0% as Showings Climbed 21.4%
May ended with an active inventory of 2,986 homes, down 25.0% from 3,980 a year ago. Roughly 2,800 to 2,900 Fort Myers listings expired, were terminated, or were withdrawn from the market over the past 12 months without returning to the market. We refer to this as Shadow Inventory. Shadow Inventory does not mean these homes are guaranteed to come back. It simply shows how many sellers recently tried to sell, stopped, and have not yet returned. These sellers may decide to return to the market with a new agent or at a new price point. Lee County lis pendens filings add a separate public-records read on owner pressure. They sit above the pre-COVID baseline through 2025 and into 2026, though they remain far below 2008-era levels.
Showings per listing reached 3.4 in May, up 21.4% year over year. That ranks third among the five cities, behind Cape Coral (5.5) and Estero (3.6) and ahead of Naples (3.1) and Bonita Springs (2.7). The median home now goes under contract after 7 showings.
The 30-year fixed-rate mortgage averaged 6.53% as of May 28, 2026, per Freddie Mac. That is up from 6.30% a month earlier and down from 6.89% a year earlier. At May’s $335,000 median sale price and 6.53%, a 20%-down conventional loan produces about $1,699 in monthly principal and interest. Property taxes, insurance, and HOA dues are additional.
Median Sale Price Rose Month-Over-Month While PPSF Stayed Near Its Recent Range
Price per square foot (PPSF) tells you what buyers are paying per square foot of living space. PPSF is a cleaner read on home value than the median price. The median sale price moves around when the mix of homes closing in a given month changes.
Fort Myers median sale price came in at $335,000 in May, down 8.3% from $365,450 a year ago and up 3.3% from the $324,303 April 2026 figure. Median PPSF was $201, down 9.0% year over year and down 2.4% from $206 in April. The month-over-month median rise alongside a slight PPSF dip indicates more larger homes closed this month at lower per-square-foot prices. The year-over-year decline in both figures continues a trend that has held through most of the past 12 months. Median has run in the $324,000 to $347,000 range across the past five months, while PPSF has held within $201 to $210.
Dollar Volume, Sold-to-List Ratio, and Price Reductions
Dollar volume reached $212 million in May, down 6.1% year over year. Closings rose 0.8% but dollar volume fell, reflecting the same shift toward lower-priced homes visible in the median.
The May sold-to-list ratio reached 96%, essentially unchanged from a year ago. Sellers received about 96% of their most recent asking price at the closing table, so the final price landed roughly 4% below list. The gap between original asking price and final sale price is much wider when prior listing attempts are included. The Relist Cost Analysis below quantifies that.
Across the active pool, price reductions have been recorded on roughly 40% of currently listed homes, similar to last month. When those reductions still don’t generate offers, listings often expire and return later as relists. That pattern is what shows up later in the relist dollar gap.
The Relist Cost Analysis Shows $47,000 in Pricing Misalignment
The relist rate measures what share of currently listed homes have already failed to sell at least once in the past 12 months. It shows how much of today’s active inventory has already been through the market before.
Of the 2,921 Fort Myers active listings in the address-matched analysis set, 777 (26.6%) have a prior listing in the trailing 12 months at the same address. That is the highest relist rate in the region. Of those 777 returning listings, 545 came back with a price reduction of 3% or more from their previous attempt. Those are eligible for Competitive Inventory if they are also under 90 days into the current attempt. The remaining 232 returned at the same price or with a reduction under 3%, so they do not count as competitive supply. Most of the 777 returning sellers (70.1%) have already absorbed at least some price adjustment from their original positions. That gives buyers a defined pool to focus on for negotiating room.
Relisted Homes Sold $47,000 Below Original Ask After 4.6× the Market Time
The relist dollar gap is the difference between what sellers originally asked and what they eventually accepted after a previous listing attempt. Across the past 4 months, relisted Fort Myers homes that sold closed a median of 11.8% below their original asking price, a median shortfall of $47,000. Combined across all listing attempts, these homes spent a median of 258 days on the market before closing. First-attempt sales cleared in 56 days. The relist process takes about 4.6 times longer to find a buyer than starting at a price recent sales support. The delay does not come from the final price alone. It comes from the time lost before the price reached the market, plus the reduced attention a listing gets after buyers have already seen it sit.
The $47,000 dollar gap is the second-lowest in the region behind Cape Coral, partly because Fort Myers price points are lower than other cities. As a percentage of original ask, Fort Myers’s 11.8% sits in the middle of the regional range (9.3% to 13.3%).
For Fort Myers buyers, the 232 returning listings without a price reduction are the first place to look for negotiating room. These are homes that have come back to market without a meaningful price reduction. The data over the past 4 months suggests these listings are less likely to clear without a meaningful price adjustment. Buyers can use recent first-attempt sales as the reference point when writing offers on those listings.
Competitive Inventory Shows Fort Myers Supply at 2.2 Months
You will see more than one supply number in this report. The MLS months of supply uses a 12-month sales pace and shows the broad market. The competitive figures below use the most recent three-month pace, which tracks current demand more closely and shows what a well-priced seller is more likely to face. Competitive Inventory sets aside stale listings, older active listings, and returning listings that came back without a meaningful price reduction. The result reflects the supply that is actively competing for buyers right now. The full active count counts fresh listings, returning relists, and stale inventory equally.
Three-part breakdown for Fort Myers:
- All active listings at the recent 3-month sales pace: 5.0 months (the MLS months of supply of 6.4 uses a slower 12-month pace)
- Stale-stripped months of supply: 3.9 (after removing 628 listings at 180-plus days on market without a meaningful reduction)
- Competitive Months of Supply: 2.2 (after additionally removing returning listings without a meaningful price reduction and listings 90 to 179 days old, for a resulting count of 1,319 listings under 90 days that are first-attempt or meaningful relists)
Asking Prices the Second-Tightest in the Region
Fort Myers’s active asking PPSF runs 5.7% above the recent sold PPSF overall. This compares the median PPSF of homes currently for sale ($215) to the median PPSF of homes that have closed over the past 4 months ($204). Sellers are asking a bit more per square foot than buyers have recently been willing to pay. This is a market-level comparison and does not appraise any specific home. The two figures look at different time frames. Active asks are a snapshot of what sellers want right now, while sold PPSF reflects what buyers paid over the last 4 months.
By price range, the spread is 4.9% under $400K, 1.6% from $400K to $750K, 4.5% from $750K to $1.5M, and 7.3% from $1.5M to $3M. Above $3M, a thin sample of 9 closings produces a slightly negative spread of -2.4%.
Fort Myers does not have the kind of asking-price gap concentration that Bonita Springs shows. The widest in-range spread is 7.3% from $1.5M to $3M, narrower than every price range in Bonita Springs except $400K to $750K. The $400K to $750K range at 1.6% is the segment most closely aligned with recent sales in the city.
Insurance context note: Florida’s homeowners insurance environment affects both sides of the deal. It can influence why some owners decide to sell, and it can change a buyer’s total cost enough to affect whether a contract still works. Pre-2002 single-family homes, manufactured homes, and properties in flood zones along the Caloosahatchee can produce coverage adjustments during the contract period that change a buyer’s annual cost of ownership enough to matter.
Worthington Realty Market Lens
The metrics below come from address-level analysis across all five cities. Fort Myers’s row is highlighted.
| City | Competitive Months of Supply | Relist Rate | Ask-Bid Gap (PPSF%) | Pending-to-Active Ratio | First-Attempt Median DOM | Relist Combined Median DOM |
|---|---|---|---|---|---|---|
| Fort Myers | 2.2 | 26.6% | 5.7% | 23.8% | 56 | 258 |
| Cape Coral | 2.3 | 22.8% | 13.7% | 30.1% | 49 | 246 |
| Estero | 1.4 | 21.7% | 4.4% | 30.1% | 61 | 268 |
| Bonita Springs | 1.7 | 25.2% | 15.3% | 22.0% | 61 | 272 |
| Naples | 2.1 | 24.4% | 12.0% | 24.1% | 57 | 260 |
Source: FGCMLS via Stellar MLS. Full definitions for each metric are in Worthington’s market methodology. Worthington’s address-level metrics come from a property-level MLS export, a separate dataset from the published monthly counts used for the headline figures, so the active total can differ slightly.
Closed Comparables Are Setting the Pace in Fort Myers Featured Communities
The six Fort Myers communities highlighted below span a wide price range. Condo and villa medians start at $271,250 (Lexington Country Club) and single-family medians reach $1.27 million (WildBlue). Closing volume across the six this cycle ranges from 28 (Timber Creek) to 80 (Lexington). The closed comparables this month show that pricing to recent sales at the sub-community level matters more than the community-wide median across all six.
Arrows show month-over-month change versus the May 2026 cycle. Count and price metrics show percent change. Ratio and inventory metrics show point (pts) or month (mos) change.
Verandah
- Active Listings: 40 (↓ 13.0% MoM)
- Sold (Last 120 Days): 48 (↓ 2.0% MoM)
- Homes Pending: 11 (↓ 15.4% MoM)
- Pending-to-Active Ratio: 27.5% (↓ 0.8 pts MoM)
- Previously Listed Share of Active: 17.5% (↓ 21.6 pts MoM)
- Months of Inventory: 3.3 (↓ 0.5 mos MoM)
- Median Sold Price: $452,500 (→ MoM)
- Sellers Received: 96.3% of asking price (↑ 0.3 pts MoM)
Active inventory fell 13% from the May cycle to 40 listings against 48 closings, holding months of supply at 3.3 and the relist share down sharply to 17.5% from 39.1% as last cycle’s returning sellers cleared or pulled. Closings covered a wide range across neighborhoods. Pebblebrook produced 7 at a $320,000 median and Lakeview 6 at $355,000 on the lower end, while Otter Bend closed 3 at $554,000 and Heritage Preserve 3 at $455,000 higher up. The active pool is concentrated in Heritage Preserve, where 8 listings ask a $497,000 median, alongside Cypress Marsh and Magnolia Isles listings near $740,000. Those asks sit well above where Heritage Preserve has been closing. Idlewild listings ask $275,000 against a $265,000 closed median, much closer to recent sales. Sellers who price to recent closings on their own street rather than the community-wide asking range are the ones finding buyers on the first attempt.
Search Verandah homes for sale
The Plantation
- Active Listings: 42 (↓ 6.7% MoM)
- Sold (Last 120 Days): 48 (↑ 2.1% MoM)
- Homes Pending: 12 (↓ 33.3% MoM)
- Pending-to-Active Ratio: 28.6% (↓ 11.4 pts MoM)
- Previously Listed Share of Active: 23.8% (↓ 2.9 pts MoM)
- Months of Inventory: 3.5 (↓ 0.3 mos MoM)
- Median Sold Price: $597,500 (↑ 3.0% MoM)
- Sellers Received: 96.7% of asking price (↑ 0.3 pts MoM)
Pending contracts dropped to 12 from 18 and the pending-to-active ratio eased 11 points to 28.6%, with active inventory down 6.7% to 42 and months of supply at 3.5. Bridgetown and Somerset are pricing and clearing on separate tracks. Over the past 120 days Bridgetown closed 30 of the 48 sales at a $493,000 median in 39 days, while Somerset’s 18 closings settled at an $859,000 median over 46 days. The active pool splits evenly, 23 Bridgetown listings at a $489,000 median ask and 19 Somerset at $485,000, with Somerset listings sitting 97 days against Bridgetown’s 62. The Somerset asks are well below recent Somerset closings, which points to smaller or lower-priced homes currently listed there. Buyers seeking the faster, lower-priced pace are finding it in Bridgetown. Somerset sellers should anchor to recent closings within their own price tier rather than the active range.
Search The Plantation homes for sale
Pelican Preserve
- Active Listings: 46 (↓ 9.8% MoM)
- Sold (Last 120 Days): 72 (→ MoM)
- Homes Pending: 16 (↓ 20.0% MoM)
- Pending-to-Active Ratio: 34.8% (↓ 4.4 pts MoM)
- Previously Listed Share of Active: 19.6% (↓ 3.9 pts MoM)
- Months of Inventory: 2.6 (↓ 0.2 mos MoM)
- Median Sold Price: $425,000 (→ MoM)
- Sellers Received: 96.8% of asking price (↓ 0.2 pts MoM)
Active listings fell 9.8% from May to 46 against 72 closings, bringing months of supply to 2.6 and pending contracts down to 16. The community-wide $425,000 closed median holds where the highest-volume sub-communities cluster. Materita closed 13 at a $413,000 median in 23 days, Prato 10 at $442,000, Carena 9 at $590,000, and Casella 8 at $496,000. The active pool runs lower than recent closings, concentrated in Prato at a $529,000 median ask, plus Ravenna, Palazzo, and Siena listings in the $248,000 to $274,000 range. The 96.8% sold-to-list ratio across 72 closings indicates consistently realistic pricing through this 55-plus community. Buyers focused on $400,000 to $500,000 coach homes face the steadiest competition, since that is where closing volume concentrated. Lower-priced condo selection in Ravenna, Palazzo, and Siena is more open right now.
Search Pelican Preserve homes for sale
Timber Creek
- Active Listings: 27 (↓ 6.9% MoM)
- Sold (Last 120 Days): 28 (→ MoM)
- Homes Pending: 13 (↑ 30.0% MoM)
- Pending-to-Active Ratio: 48.1% (↑ 13.6 pts MoM)
- Previously Listed Share of Active: 29.6% (↑ 2.0 pts MoM)
- Months of Inventory: 3.9 (↓ 0.2 mos MoM)
- Median Sold Price: $572,500 (→ MoM)
- Sellers Received: 98.0% of asking price (↑ 0.6 pts MoM)
Pending contracts rose to 13 from 10 and the pending-to-active ratio jumped 14 points to 48.1%, with active inventory down 6.9% to 27 and months of supply at 3.9. Timber Creek offers a single home type, so the price story sits in the spread between asking and recent sales. The 28 closings over the past 120 days cleared at a 98.0% sold-to-list ratio and a 43-day median time to sell, settling at a $572,500 median. The 27 active listings ask a $535,000 median, below the closed median, which indicates the available inventory holds fewer of the larger single-family homes that drove recent closings. A 29.6% relist share, near the caution threshold, means roughly a quarter of current listings have already failed to sell once in the past year. Buyers ready to act on the larger homes should expect to compete, while the smaller-square-footage inventory offers more selection.
Search Timber Creek homes for sale
Lexington Country Club
- Active Listings: 32 (↓ 5.9% MoM)
- Sold (Last 120 Days): 80 (↑ 6.7% MoM)
- Homes Pending: 11 (↓ 21.4% MoM)
- Pending-to-Active Ratio: 34.4% (↓ 6.8 pts MoM)
- Previously Listed Share of Active: 21.9% (↓ 1.6 pts MoM)
- Months of Inventory: 1.6 (↓ 0.2 mos MoM)
- Median Sold Price: $271,250 (→ MoM)
- Sellers Received: 96.2% of asking price (→ MoM)
Closings rose 6.7% from May to 80 against just 32 active listings, holding months of supply at 1.6 with pending contracts at 11. The $271,250 community median tracks the high-volume condo and villa neighborhoods. Waterford closed 20 at a $250,000 median, Southmont Cove 17 at $231,000, Wedgewood 13 at $350,000, and Sommerset Villas 13 at $280,000. Separately, 11 single-family homes in the Golf Village neighborhoods cleared at a $710,000 median in 30 days. The active pool carries 8 of those single-family homes at a $685,000 median ask alongside lower-priced condos and villas in Waterford, Southmont Cove, and Sommerset Villas. Golf Village single-family buyers and sellers should work from recent comparable sales within their own sub-area, since the community-wide median sits far below that tier. With supply this thin against steady closing volume, correctly priced condo and villa sellers are clearing close to ask this season.
Search Lexington Country Club homes for sale
WildBlue
- Active Listings: 33 (↑ 13.8% MoM)
- Sold (Last 120 Days): 29 (↓ 3.3% MoM)
- Homes Pending: 3 (↓ 70.0% MoM)
- Pending-to-Active Ratio: 9.1% (↓ 25.4 pts MoM)
- Previously Listed Share of Active: 18.2% (↑ 1.0 pts MoM)
- Months of Inventory: 4.6 (↑ 0.7 mos MoM)
- Median Sold Price: $1,270,000 (↓ 10.9% MoM)
- Sellers Received: 96.8% of asking price (↓ 0.1 pts MoM)
Pending contracts fell to 3 from 10 and active inventory rose 13.8% to 33, pushing months of supply up to 4.6 as the luxury pace eased into summer. The price tiers tell the story. WildBlue proper closed 18 at a $1,794,500 median in 65 days, while Vista WildBlue closed 11 at $1,199,000 in 62 days, and the community-wide median fell 10.9% from May as the closing mix shifted. WildBlue proper active listings ask $1,799,000 against that $1,794,500 closed median, nearly aligned. Vista WildBlue’s 15 active listings ask a $975,000 median, below the $1,199,000 Vista closed median, with those listings on the market just 22 days as recent entries priced to move. A 18.2% relist share means most listings have not previously failed to sell. Vista buyers will find the closest alignment between asking and recent sales, so writing near the active range is reasonable there.
Search WildBlue homes for sale
Frequently Asked Questions
Fort Myers holds the second-tightest active-vs-sold PPSF spread in the region at 5.7%, behind Estero. Active inventory is down 25.0% year over year and months of supply sits at 6.4. Closings have grown year over year for nine straight months.
The May sold-to-list ratio reached 96% (about 4% below the most recent list price). The median relisted home sold at $47,000 (11.8%) below original ask after roughly 8.6 months of combined market exposure. Offer strategy should reference recent neighborhood sales rather than the active asking range.
The median sale price fell 8.3% year over year and PPSF fell 9.0%. Both reflect more lower-priced homes selling, with some genuine value softening at the per-square-foot level. Downtown and lower-priced condos are pulling the median down. Single-family in the Daniels Parkway corridor and communities like WildBlue continue to clear at strong per-square-foot levels.
First-attempt listings priced close to recent sales sold in a median of 56 days. Relisted homes that eventually sold took 258 days combined across all attempts. The 4.6x difference is the cost of pricing above where similar homes are clearing.
Fort Myers asking prices sit close to recent sold prices, a 5.7% spread, the second-tightest in Southwest Florida behind Estero’s 4.4%. The high relist rate of 26.6% is part of the reason. Most of those returning sellers came back only after cutting their price, so the listings on the market now are priced nearer to where buyers are actually closing.
Track the Fort Myers Market in Real Time
Create a free account to save searches and receive alerts on new listings, price reductions, and status changes for the homes you’re watching.
The Bottom Line for Fort Myers
Fort Myers’ May report is mostly a relist story. The closing-growth streak reached nine consecutive months, and pricing alignment held second only to Estero in the region. The relist rate at 26.6% points to a meaningful pool of returning sellers, most of whom have already accepted at least some price adjustment.
What Buyers and Sellers Should Take From May
For buyers, the 232 returning listings without a price reduction are the most direct path to negotiating room. For sellers, the 56-day first-attempt median is the timing benchmark, and pricing close to recent comparable sales in the same neighborhood is what brings buyers in.
The Worthington team works with buyers and sellers across Fort Myers neighborhoods every week. That includes Lexington Country Club, Pelican Preserve, WildBlue, the Daniels Parkway Corridor, and the broader Fort Myers area. Knowing the relist rate is one thing. Pricing your specific home so it sells on the first attempt is what we do alongside our clients.
Schedule a 15-minute conversation to discuss your situation →
All data referenced in Worthington’s market reports draws from the Florida Gulf Coast MLS (FGCMLS via Stellar MLS) unless otherwise noted.
May 2026 Southwest Florida Housing Market Report Series
- Southwest Florida Months of Supply Falls to 6.7 in May
- Cape Coral Pending Sales Rose 18.8% Year Over Year
- Estero Ask-Bid Gap Is the Tightest in Southwest Florida
- Bonita Springs Inventory Fell 28.7% Year Over Year
- Naples Closed Sales Grew for the 12th Month in a Row
Worthington MLS Search by City
Fort Myers | Cape Coral | Estero | Bonita Springs | Naples
For a full explanation of the indicators used in this report, see how Worthington Realty analyzes the Southwest Florida housing market.