

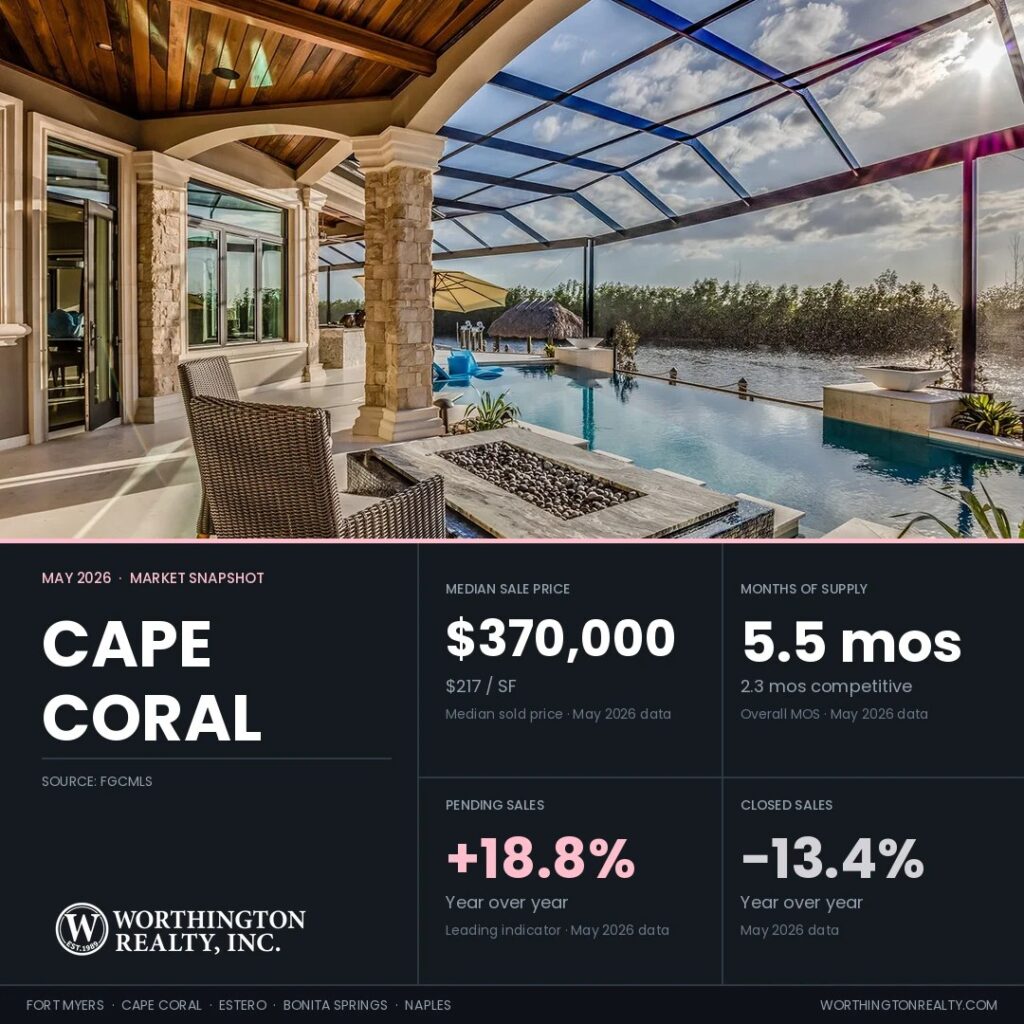
Cape Coral Pending Sales Rose 18.8% Year Over Year as Closings Dipped
Cape Coral pending sales rose 18.8% in May to 614 new contracts, even as closings fell 13.4%. That split is the story this month: closings slipped while pending sales rose, showings increased, and median days on market shortened.
Buyers scheduled more showings per listing than in any other city in the region, sellers received the highest share of their asking price in Southwest Florida at 98%, and the homes that sold did it in 44 days, the fastest of the five cities. Set against the region’s best demand signals, one soft closing month does not yet confirm demand weakness. For sellers, the move is straightforward: price to recent comparables, because the buyers are showing up.
Data reflects MLS records as of June 1, 2026. MLS figures may update as late transactions are recorded.
Key Takeaways
- Cape Coral buyer activity ran against the usual May slowdown. Pending sales normally soften from April to May, but this year they rose. That makes the lower closing count look more like a timing issue than confirmed demand weakness.
- Showings per listing reached 5.5, up 48.6% year over year, the most of the five cities this month, with the next-busiest 1.9 behind.
- The sold-to-list ratio rose to 98%, the highest in Southwest Florida, with median days on market dropping to 44 days.
- Closed sales came in at 505, down 13.4% year over year. The single-month dip ran against every other demand indicator in the report.
- Active inventory fell 28.4% year over year to 2,759 homes, with months of supply dropping from 8.6 to 5.5.
Regional Snapshot at a Glance
Here is how Cape Coral compares with the other Southwest Florida cities Worthington tracks.
| City | Median Sold Price | Median YoY | Price/SF | Price/SF YoY | Active Listings | Active YoY | Months of Supply | Months Supply YoY | Sold-to-List | Closed Sales | Closed YoY |
|---|---|---|---|---|---|---|---|---|---|---|---|
| Fort Myers | $335,000 | -8.3% | $201 | -9.0% | 2,986 | -25.0% | 6.4 | -34.7% | 96% | 503 | +0.8% |
| Cape Coral | $370,000 | +2.8% | $217 | -0.5% | 2,759 | -28.4% | 5.5 | -36.0% | 98% | 505 | -13.4% |
| Estero | $499,450 | -3.0% | $258 | -3.0% | 586 | -27.7% | 4.7 | -42.7% | 96% | 156 | +9.1% |
| Bonita Springs | $550,000 | 0.0% | $313 | -0.9% | 958 | -28.7% | 6.1 | -43.5% | 95% | 199 | +20.6% |
| Naples | $620,000 | +1.1% | $341 | +0.9% | 5,164 | -21.2% | 7.0 | -34.6% | 95% | 821 | +9.3% |
| Southwest Florida | $405,000 | +1.2% | $240 | -0.8% | 18,198 | -22.0% | 6.7 | -32.3% | 96% | 3,004 | -0.3% |
Source: FGCMLS via Stellar MLS. Single-month data unless otherwise noted. Southwest Florida reflects the entire Florida Gulf Coast MLS and is broader than the five featured cities combined.
Pending Sales and Showings Rose Even as Closings Fell
A home that closed in May usually went under contract a month or two earlier, so closings look backward. Pending sales and showings show what buyers are doing now, and they feed next month’s closings. Both rose in May even as closings dipped.
Cape Coral recorded 505 closed sales in May, down 13.4% from May 2025, the only year-over-year closing decline among the five cities. Pending sales, by contrast, reached 614 new contracts in May, up 18.8% from a year ago. The snapshot Pending-to-Active Ratio of 30.1% (all currently pending homes against active listings, not just May’s new contracts) ties Estero at the top of the five-city group, well above the five-city snapshot average of 25.5%. Cape Coral and Fort Myers were the two cities in the region with more new pending contracts in May than May closings.
Showings per listing reached 5.5 in May, up from 3.7 a year ago (a 48.6% increase) and up from 4.8 in April. The average Cape Coral home is getting more buyer attention than any other city Worthington tracks. Cape Coral’s median home now goes under contract after 11.5 showings, up from 9 a year ago and up sharply from 6 in April. Buyers were touring more before committing.
New listings totaled 691 in May, down 18.7% from a year ago. Some of those listings are homes coming back after a previous listing attempt under new MLS numbers, identified by matching addresses against expired, withdrawn, and terminated listings from the trailing 12 months.
Inventory Fell 28.4% Year Over Year, Second Only to Bonita Springs
May ended with an active inventory of 2,759 homes, down 28.4% from 3,853 a year ago. That is the second-largest year-over-year inventory decline in the region after Bonita Springs (-28.7%). Roughly 2,900 to 3,000 Cape Coral listings expired, were terminated, or were withdrawn from the market over the past 12 months without returning to the market. We refer to this as Shadow Inventory. Shadow Inventory does not mean these homes are guaranteed to come back. It simply shows how many sellers recently tried to sell, stopped, and have not yet returned. The Cape Coral count runs modestly above the active listing count, a potential supply overhang if conditions shift.
Lee County lis pendens filings add a separate public-records read on owner pressure. They sit above the pre-COVID baseline through 2025 and into 2026, though they remain far below 2008-era levels.
The 30-year fixed-rate mortgage averaged 6.53% as of May 28, 2026, per Freddie Mac. That is up from 6.30% a month ago and down from 6.89% a year ago. At May’s $370,000 median sale price and 6.53%, a 20%-down conventional loan produces about $1,877 in monthly principal and interest. Property taxes, insurance, and HOA dues are additional. The 23-basis-point rate climb late in May coincided with the rise in median showings-to-pending count (6 to 11.5). The rate move may have contributed to buyers touring more homes before committing.
Price Per Square Foot Held Within 1% of a Year Ago
Price per square foot (PPSF) tells you what buyers are paying per square foot of living space. PPSF is a cleaner read on home value than the median price. The median sale price moves around when the mix of homes closing in a given month changes.
Cape Coral median sale price came in at $370,000 in May, up 2.8% from $360,000 a year ago and up 1.0% from $366,500 in April 2026. Median PPSF was $217, down 0.5% year over year and up 0.5% from $216 in April. Both metrics have held within a tight band for the past 12 months. Median sale price has bounced between $350,000 and $375,000 across the past five months, and PPSF has held within $206 to $219 since last fall. Cape Coral homeowners can read this as value stability with modest month-to-month variation.
Dollar Volume, Sold-to-List Ratio, and Price Reductions
Dollar volume (the total dollars exchanged across all closings) reached $250 million, down 3.3% year over year. Closings fell 13.4% while dollar volume fell only 3.3%, indicating the lower closing count was offset by a larger share of higher-priced homes selling. The average sale price rose modestly versus May 2025.
The May sold-to-list ratio reached 98%, the highest in the region and up from 97% in April. Sellers received about 98% of their most recent asking price at the closing table, so the final price landed roughly 2% below list. The gap between original asking price and final sale price is wider when prior listing attempts are included. The Relist Cost Analysis below shows the spread.
Price reductions have been recorded on roughly 35% to 40% of currently listed Cape Coral homes, similar to last month. When those reductions still don’t generate offers, listings often expire and return later as relists.
The Relist Cost Analysis Shows $39,950 in Pricing Misalignment
The relist rate measures what share of currently listed homes have already failed to sell at least once in the past 12 months. It shows how much of today’s active inventory has already been through the market before.
Of the 2,735 Cape Coral active listings in the address-matched analysis set, 623 (22.8%) have a prior listing in the trailing 12 months at the same address. Cape Coral has the second-lowest relist rate in the region after Estero (21.7%). A smaller share of Cape Coral sellers have already gone through a previous listing attempt than in Fort Myers (26.6%) or Bonita Springs (25.2%). Of those 623 returning listings, 399 came back with a price reduction of 3% or more from their previous attempt. Those are eligible for Competitive Inventory if they are also under 90 days into the current attempt. The remaining 224 returned at the same price or with a reduction under 3%, so they do not count as competitive supply.
Relisted Homes Sold $39,950 Below Original Ask After 5× the Market Time
The relist dollar gap is the difference between what sellers originally asked and what they eventually accepted after a previous listing attempt. Across the past 4 months, relisted Cape Coral homes that sold closed a median of 9.3% below their original asking price, a median shortfall of $39,950, the smallest dollar and percentage gap in the region. Combined across all listing attempts, these homes spent a median of 246 days on the market before closing. First-attempt sales cleared in 49 days. The relist process takes about 5 times longer to find a buyer than starting at a price recent sales support. The delay does not come from the final price alone. It comes from the time lost before the price reached the market, plus the reduced attention a listing gets after buyers have already seen it sit.
The 224 returning listings without a price reduction in Cape Coral’s active pool are largely concentrated on Gulf-access waterfront and saltwater canal homes. In those segments, sellers continue to test pricing meaningfully above where the market has actually been clearing. Buyers shopping waterfront may find more negotiating room than the asking price suggests. Use recent sold prices as the reference point when writing offers. Active asking prices on these listings are running ahead of where homes have been clearing.
Competitive Inventory Shows Cape Coral Supply at 2.3 Months
You will see more than one supply number in this report. The MLS months of supply uses a 12-month sales pace and shows the broad market. The competitive figures below use the most recent three-month pace, which tracks current demand more closely and shows what a well-priced seller is more likely to face. Competitive Inventory sets aside stale listings, older active listings, and returning listings that came back without a meaningful price reduction. The result reflects the supply that is actively competing for buyers right now.
Three-part breakdown for Cape Coral:
- All active listings at the recent 3-month sales pace: 4.7 months (the MLS months of supply of 5.5 uses a slower 12-month pace)
- Stale-stripped months of supply: 3.8 (after removing 533 listings at 180-plus days on market without a meaningful reduction)
- Competitive Months of Supply: 2.3 (after additionally removing returning listings without a meaningful price reduction and listings 90 to 179 days old, for a resulting count of 1,323 listings under 90 days that are first-attempt or meaningful relists)
The 13.7% Ask-Bid Gap Reflects a Different Mix of Active and Sold Homes
Cape Coral’s active asking PPSF runs 13.7% above the recent sold PPSF overall. This compares the median PPSF of homes currently for sale ($243) to the median PPSF of homes that have closed over the past 4 months ($214). Sellers are asking more per square foot than buyers have recently been willing to pay. This is a market-level comparison and does not appraise any specific home. Active asks are a snapshot of what sellers want right now. Sold PPSF reflects what buyers paid over the last 4 months.
Under $400K, the spread is 7.0%. The $400K to $750K range comes in at 3.6%, and $750K to $1.5M at 7.8%. From $1.5M to $3M, active asks actually sit 2.6% below recent closed sales. Above $3M, the sample is too thin to report (3 closings).
The overall 13.7% reflects a higher-priced active pool concentrated on Gulf-access and saltwater-canal homes against a closed mix weighted toward inland resale. When you group homes by price range, asking and sold prices align more closely than the overall figure suggests. The $400K to $750K range at 3.6% is the segment most closely aligned with recent sales in the city.
The snapshot Pending-to-Active Ratio of 30.1% ties Estero at the top of the five-city group and runs above the five-city snapshot average of 25.5%.
Insurance context note: Florida’s homeowners insurance environment affects both sides of the deal in Cape Coral. It can influence why some owners decide to sell, and it can change a buyer’s total cost enough to affect whether a contract still works. Pre-2002 single-family homes, Gulf-access listings, and saltwater-canal properties frequently produce coverage adjustments during the contract period that change the buyer’s annual cost of ownership.
Worthington Realty Market Lens
The metrics below come from address-level analysis across all five cities. Cape Coral’s row is highlighted.
| City | Competitive Months of Supply | Relist Rate | Ask-Bid Gap (PPSF%) | Pending-to-Active Ratio | First-Attempt Median DOM | Relist Combined Median DOM |
|---|---|---|---|---|---|---|
| Fort Myers | 2.2 | 26.6% | 5.7% | 23.8% | 56 | 258 |
| Cape Coral | 2.3 | 22.8% | 13.7% | 30.1% | 49 | 246 |
| Estero | 1.4 | 21.7% | 4.4% | 30.1% | 61 | 268 |
| Bonita Springs | 1.7 | 25.2% | 15.3% | 22.0% | 61 | 272 |
| Naples | 2.1 | 24.4% | 12.0% | 24.1% | 57 | 260 |
Source: FGCMLS via Stellar MLS. Full definitions for each metric are in Worthington’s market methodology. Worthington’s address-level metrics come from a property-level MLS export, a separate dataset from the published monthly counts used for the headline figures, so the active total can differ slightly.
Closed Comparables Are Setting the Pace in Cape Coral Featured Communities
The five Cape Coral communities highlighted below span the city’s range of home types from inland single-family at Sandoval to Gulf-access waterfront at Cape Harbour and Tarpon Point. Community-level months of inventory runs from Sandoval’s 2.4 to Cape Harbour’s 7.1.
Arrows show month-over-month change versus the May 2026 cycle. Count and price metrics show percent change. Ratio and inventory metrics show point (pts) or month (mos) change.
Cape Harbour
- Active Listings: 30 (↓ 11.8% MoM)
- Sold (Last 120 Days): 17 (↑ 13.3% MoM)
- Homes Pending: 4 (↓ 20.0% MoM)
- Pending-to-Active Ratio: 13.3% (↓ 1.4 pts MoM)
- Previously Listed Share of Active: 23.3% (↓ 6.1 pts MoM)
- Months of Inventory: 7.1 (↓ 2.0 mos MoM)
- Median Sold Price: $525,000 (→ MoM)
- Sellers Received: 92.9% of asking price (↑ 0.5 pts MoM)
Closings rose 13.3% from May to 17 while active inventory fell 11.8% to 30, pulling months of supply down 2.0 to 7.1, still the deeper end of the supply range. The main Cape Harbour condos and villas closed 16 at a $525,000 median over 99 days, while the Harbour Preserve estate enclave shows a different market, with one closing at $2,750,000 and three active listings asking a $3,400,000 median. The overall active pool asks a $612,000 median against the $525,000 closed median, and active listings carry a 158.5-day median on market. Sellers collected 92.9% of asking, a wider spread between list and sold. A 23.3% relist share, with returning sellers cutting about 13.8% before coming back, marks a pool of listings that have already corrected once. Buyers here have room to negotiate, particularly on listings that have already been sitting well past the closing pace.
Search Cape Harbour homes for sale
Cape Royal
- Active Listings: 10 (↓ 9.1% MoM)
- Sold (Last 120 Days): 11 (→ MoM)
- Homes Pending: 1 (↓ 66.7% MoM)
- Pending-to-Active Ratio: 10.0% (↓ 17.3 pts MoM)
- Previously Listed Share of Active: 50.0% (↑ 13.6 pts MoM)
- Months of Inventory: 3.6 (↓ 0.4 mos MoM)
- Median Sold Price: $610,000 (→ MoM)
- Sellers Received: 97.0% of asking price (→ MoM)
Pending contracts fell to 1 and active inventory eased to 10, with closings at 11 over the past 120 days. With a sample this thin, one transaction can move these figures, so the $610,000 community median is best read alongside comps within your specific section. Cape Royal proper closed 7 at a $620,000 median in 74 days, while Royal Tee Country Club Estates closed 4 at $599,500 in just 16 days, a faster pace at a slightly lower price. The 9 active Cape Royal listings ask a $799,000 median, well above where either section has been closing. The relist share climbed to 50% of active supply, half of which have already failed to sell once in the past year. Buyers should treat the overall median cautiously, focus on the section and lot type they are considering, and pay particular attention to listings asking well above recent closings.
Search Cape Royal homes for sale
Sandoval
- Active Listings: 26 (→ MoM)
- Sold (Last 120 Days): 43 (↑ 7.5% MoM)
- Homes Pending: 15 (→ MoM)
- Pending-to-Active Ratio: 57.7% (→ MoM)
- Previously Listed Share of Active: 19.2% (↓ 15.4 pts MoM)
- Months of Inventory: 2.4 (↓ 0.2 mos MoM)
- Median Sold Price: $355,000 (→ MoM)
- Sellers Received: 96.0% of asking price (↑ 0.4 pts MoM)
Closings rose 7.5% from May to 43 with 15 contracts pending against 26 active, a 57.7% pending-to-active ratio and 2.4 months of inventory. The relist share dropped to 19.2% from last cycle. The main Sandoval single-family homes closed 21 at a $390,000 median, while the Somerville carriage homes closed 6 at $250,000 and Greendale 5 at $370,000, so home type separates the price tiers within the gates. The active pool asks a $469,000 median in the main neighborhood, with Somerville carriage homes near $298,000. Sellers received 96.0% of asking across the 43 closings. Buyers should match comps to home type, since a Somerville carriage home and a main Sandoval single-family home occupy different price points. With supply tight at 2.4 months and demand steady, sellers of well-kept, correctly priced homes are finding buyers quickly this cycle.
Search Sandoval homes for sale
Tarpon Point
- Active Listings: 12 (↓ 25.0% MoM)
- Sold (Last 120 Days): 9 (↓ 10.0% MoM)
- Homes Pending: 1 (↑ MoM)
- Pending-to-Active Ratio: 8.3% (↑ 8.3 pts MoM)
- Previously Listed Share of Active: 33.3% (↑ 2.1 pts MoM)
- Months of Inventory: 5.3 (↓ 1.1 mos MoM)
- Median Sold Price: $875,000 (↓ 4.0% MoM)
- Sellers Received: 95.3% of asking price (↑ 1.5 pts MoM)
Active inventory fell 25% from May to 12 against 9 closings, a thin sample where one transaction can swing the numbers, so the $875,000 median is best read alongside comps within your specific enclave. Tarpon Landings condos closed 7 at a $950,000 median in 90 days, while Tarpon Gardens coach homes closed 2 at $630,000 in 9 days. The active pool holds 8 Tarpon Landings listings asking a $1,087,500 median and 4 Tarpon Gardens at $598,000, so the enclaves occupy sharply different price points. Active listings carry a 219.5-day median on market. A third of active listings have been on the market before, with returning sellers cutting about 12.4%. Buyers should focus on the specific enclave that fits, since an overall figure tells them little, and negotiate against that enclave’s recent closings rather than the longer-standing asking prices.
Search Tarpon Point homes for sale
Cape Coral Yacht Club
- Active Listings: 13 (↓ 27.8% MoM)
- Sold (Last 120 Days): 12 (→ MoM)
- Homes Pending: 4 (↑ 100.0% MoM)
- Pending-to-Active Ratio: 30.8% (↑ 19.7 pts MoM)
- Previously Listed Share of Active: 46.2% (↓ 3.8 pts MoM)
- Months of Inventory: 4.3 (↓ 1.7 mos MoM)
- Median Sold Price: $639,950 (↑ 18.0% MoM)
- Sellers Received: 94.7% of asking price (↑ 1.1 pts MoM)
Active inventory fell 27.8% from May to 13 and pending contracts doubled to 4, pulling months of supply down 1.7 to 4.3. With 12 closings over the past 120 days, the $639,950 median stays volatile, so Gulf-access comps within your block matter more than the community figure. The median rose 18.0% from May as the closing mix shifted toward higher-value waterfront homes. The Yacht Club neighborhood itself accounted for 11 of the 12 closings at a $680,000 median in 43 days, a mix of vintage ranches and modern rebuilds that spreads values widely. Sellers collected 94.7% of asking, consistent with this neighborhood’s pattern of homes selling under list. Nearly half of active listings have been on the market before, a 46.2% relist share. Buyers often hold negotiating room here, particularly on listings that have already been through a prior attempt.
Search Cape Coral Yacht Club homes for sale
Frequently Asked Questions
Cape Coral leads the region on buyer engagement (5.5 showings per listing, up 48.6% YoY) and sold-to-list ratio (98%). First-attempt listings sell at a 49-day median. Active inventory dropped 28.4% year over year. Expect competition on inland resale and more selection on Gulf-access waterfront, where 224 returning listings without a price reduction offer negotiating opportunities.
May closings came in 13.4% below May 2025. Pending sales rose 18.8%, showings reached 5.5, and median DOM dropped to 44 days. The closing dip looks more like a timing issue than a confirmed demand slowdown, based on pending sales, showings, and DOM. May 2026’s pending count of 614 gives June closings a stronger pipeline to work from.
The May sold-to-list ratio reached 98%, the highest in the region. Buyers negotiated about 2% off the most recent listed price. On the relist pool the spread is wider: the median relisted home sold at $39,950 (9.3%) below original ask after roughly 8.2 months of combined market exposure.
The overall 13.7% spread is largely mix-driven rather than a within-range gap between asking and sold prices. Under $400K, the spread is 7.0%. From $400K to $750K, 3.6%. From $750K to $1.5M, 7.8%. Above $1.5M, active asks sit below recent closed sales. The wider overall figure reflects a higher-priced active pool weighted toward waterfront.
Yes, particularly on older waterfront and saltwater-canal homes. Pre-2002 single-family homes and Gulf-access listings frequently produce coverage adjustments during the contract period.
Track the Cape Coral Market in Real Time
Create a free account to save searches and receive alerts on new listings, price reductions, and status changes for the homes you’re watching.
The Bottom Line for Cape Coral
Cape Coral’s May comes down to a split: closings fell, but pending sales and showings rose. Showings per listing reached 5.5 (up 48.6% year over year) and the sold-to-list ratio held at 98%. The single-month closing count came in 13.4% below May 2025. The wider overall active-vs-sold PPSF spread reflects mix differences between active and recently sold pools. When grouped by price range, asking and sold prices align tightly across most segments.
What Buyers and Sellers Should Take From May
Buyers looking for negotiating room may want to start with the 224 returning listings that came back without a price reduction. Those listings already tested the market without getting a buyer at the prior number. For sellers, Cape Coral’s 98% sold-to-list ratio is the regional benchmark for well-priced first-attempt listings clearing close to ask. Pricing from recent comparable sales on the same canal or block gives sellers the cleanest benchmark, in line with the 49-day first-attempt median.
The Worthington team works with buyers and sellers across Cape Coral neighborhoods every week. That includes Cape Harbour, Sandoval, Tarpon Point, and the broader Cape Coral area. Pending sales tell you the demand is there. Pricing a specific Cape Coral home to capture it is what we do alongside our clients.
Schedule a 15-minute conversation to discuss your situation →
All data referenced in Worthington’s market reports draws from the Florida Gulf Coast MLS (FGCMLS via Stellar MLS) unless otherwise noted.
May 2026 Southwest Florida Housing Market Report Series
- Southwest Florida Months of Supply Falls to 6.7 in May
- Fort Myers Has the Highest Relist Rate in Southwest Florida
- Estero Ask-Bid Gap Is the Tightest in Southwest Florida
- Bonita Springs Inventory Fell 28.7% Year Over Year
- Naples Closed Sales Grew for the 12th Month in a Row
Worthington MLS Search by City
Fort Myers | Cape Coral | Estero | Bonita Springs | Naples
For a full explanation of the indicators used in this report, see how Worthington Realty analyzes the Southwest Florida housing market.