

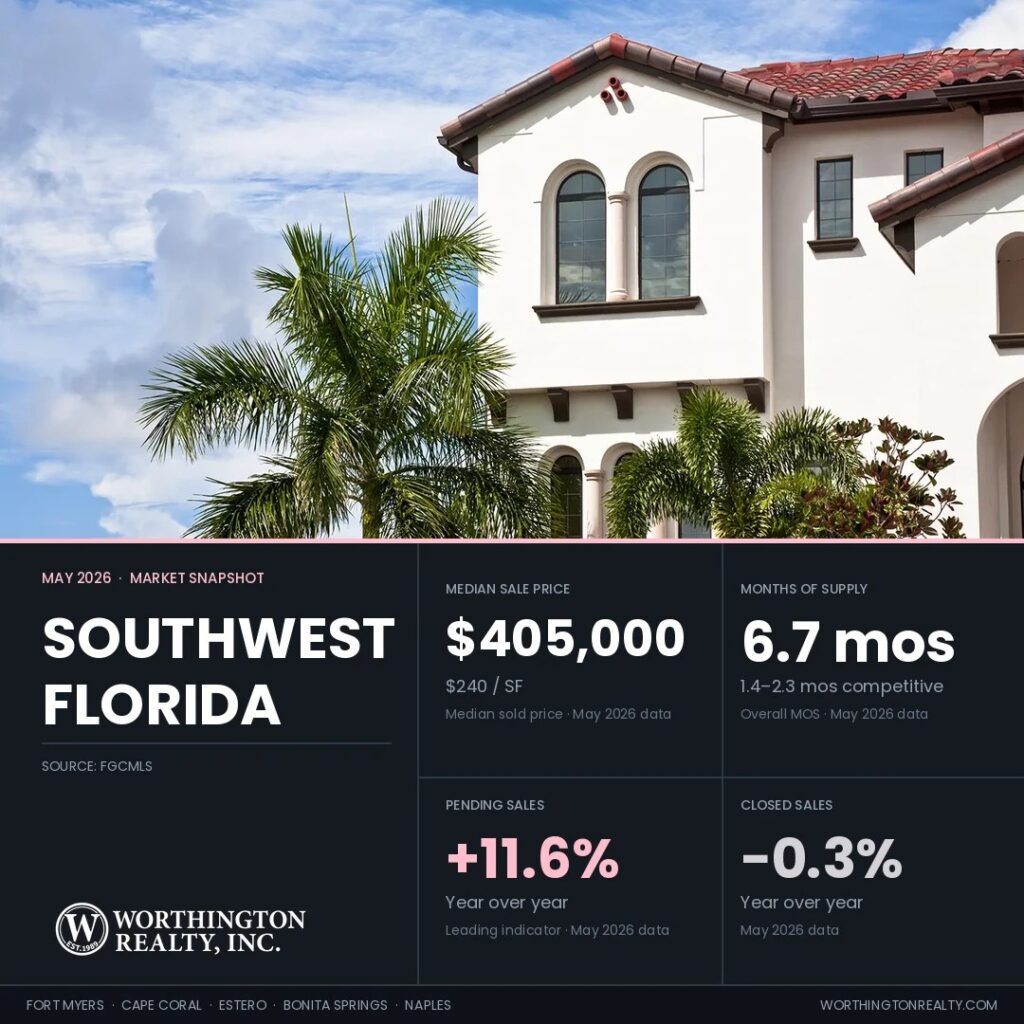
Southwest Florida Months of Supply Fell to 6.7 as Active Inventory Dropped 22.0% Year Over Year
Southwest Florida months of supply has dropped sharply over the past year. A year ago, the region was well into buyer’s market territory. Today it is just above the balanced range, with Estero and Cape Coral already inside it. Homes priced close to recent sales are still moving, and while mortgage rates ticked back up in May, buyers kept writing contracts.
Inventory is down 22% from a year ago, and pending sales are up 11.6%. For sellers, even with fewer listings competing, price is still set by what actually sold, and buyers are measuring today’s asking prices against recent closings. That standard plays out differently from city to city: Fort Myers, Cape Coral, Estero, Bonita Springs, and Naples.
Data reflects MLS records as of June 1, 2026. MLS figures may update as late transactions are recorded.
Key Takeaways
- Months of supply fell from 9.9 to 6.7, a 32.3% year-over-year drop. Across the five cities it ranges from 4.7 to 7.0, with four to six months generally considered a balanced market.
- Pending sales rose 11.6% across the region, with three cities posting double-digit growth (Bonita Springs +22.0%, Cape Coral +18.8%, Fort Myers +14.5%) and Naples up 9.9%.
- Regional prices held broadly stable while city trends split. Southwest Florida’s median rose 1.2% year over year and PPSF slipped 0.8%. Fort Myers showed the clearest softening (median -8.3%, PPSF -9.0%), Cape Coral and Naples stayed within a few points of last year, and Estero and Bonita Springs read most reliably through their three-month rolling medians.
- The 30-year fixed mortgage rate climbed back to 6.53% on May 28, up from 6.30% at the end of April. The 23-basis-point reversal coincided with a small drop in showings per listing region-wide.
- Cape Coral closings fell 13.4% year over year in May, the only city in the region to decline, even as other demand signals rose. Pending sales rose 18.8% and showings per listing reached 5.5. Buyers were still active, even though fewer sales closed in May.
- Relisted homes sold for $39,950 to $85,000 below their original asking prices across the region. Naples now leads the dollar gap at $85,000, taking the position from Bonita Springs.
Regional Snapshot at a Glance
Here is how the five Southwest Florida cities Worthington tracks compare on the headline numbers.
| City | Median Sold Price | Median YoY | Price/SF | Price/SF YoY | Active Listings | Active YoY | Months of Supply | Months Supply YoY | Sold-to-List | Closed Sales | Closed YoY |
|---|---|---|---|---|---|---|---|---|---|---|---|
| Fort Myers | $335,000 | -8.3% | $201 | -9.0% | 2,986 | -25.0% | 6.4 | -34.7% | 96% | 503 | +0.8% |
| Cape Coral | $370,000 | +2.8% | $217 | -0.5% | 2,759 | -28.4% | 5.5 | -36.0% | 98% | 505 | -13.4% |
| Estero | $499,450 | -3.0% | $258 | -3.0% | 586 | -27.7% | 4.7 | -42.7% | 96% | 156 | +9.1% |
| Bonita Springs | $550,000 | 0.0% | $313 | -0.9% | 958 | -28.7% | 6.1 | -43.5% | 95% | 199 | +20.6% |
| Naples | $620,000 | +1.1% | $341 | +0.9% | 5,164 | -21.2% | 7.0 | -34.6% | 95% | 821 | +9.3% |
| Southwest Florida | $405,000 | +1.2% | $240 | -0.8% | 18,198 | -22.0% | 6.7 | -32.3% | 96% | 3,004 | -0.3% |
Source: FGCMLS via Stellar MLS. Single-month data unless otherwise noted. Southwest Florida reflects the entire Florida Gulf Coast MLS and is broader than the five featured cities combined. Estero and Bonita Springs three-month rolling medians are $505,000 and $565,000 respectively.
Closed Sales Were Mixed in May as Cape Coral’s Streak Broke
Closed sales show what made it to the closing table. Pending sales show whether buyer activity is still feeding the next month’s closings. In May, those two readings pointed in different directions.
Closed Sales Held Flat Region-Wide
Regional closed sales reached 3,004 in May, down 0.3% from May 2025. Fort Myers recorded 503 closings (+0.8% YoY), Cape Coral 505 (-13.4%), Estero 156 (+9.1%), Bonita Springs 199 (+20.6%), and Naples 821 (+9.3%). Four of five cities recorded year-over-year closing growth, with Cape Coral the lone decline. The Naples streak extended to twelve consecutive months and remains the longest active streak. Bonita Springs reached eleven straight months of growth, Fort Myers and Estero both nine.
Regional dollar volume reached $2.17 billion, up 9.6% year over year. Naples grew 20.7% and Bonita Springs 34.1% on dollar volume, while Fort Myers (-6.1%), Cape Coral (-3.3%), and Estero (-5.5%) slipped against May 2025. The divergence between Bonita’s +20.6% closing growth and +34.1% dollar volume reflects more higher-priced homes closing this month. A few luxury closings can pull the monthly total higher in smaller markets like Bonita.
Pending Sales Rose 11.6% Across the Region
Pending sales counted 3,047 new contracts across the region in May, up 11.6% from May 2025. Bonita Springs’s pending count rose 22.0% year over year, Cape Coral 18.8%, Fort Myers 14.5%, and Naples 9.9%. Estero’s single-month pending count dipped 0.9% against May 2025 after April 2026’s 165 new contracts. For Estero, the trailing three-month pending total is the better measure, and it remains up 21.5% year over year.
Pending-to-Active shows up two ways in these reports. The first is the May-only ratio of new pending contracts to active inventory across the regional MLS, which is 16.8% (3,047 May contracts ÷ 18,198 active listings). The second is the snapshot Pending-to-Active Ratio used in each city’s Market Lens table, which counts all open pending contracts from the past 120 days against current active listings at the city level. By that snapshot method, the five-city average is 25.5%, with Cape Coral and Estero at 30.1%, Naples at 24.1%, Fort Myers at 23.8%, and Bonita Springs at 22.0%.
The May-only ratio shows how many new contracts formed this month. The snapshot ratio shows how much buyer activity is already stacked up against today’s active inventory. Regionwide, May new pending contracts slightly outpaced May closings at 3,047 to 3,004. At the city level, Fort Myers and Cape Coral had more new contracts than closings in May. Estero, Bonita Springs, and Naples had more closings than new contracts in the same month.
Showings Per Listing Climbed Year Over Year in Every City
Showings per listing reached 3.2 region-wide, up from 2.9 a year ago. Cape Coral at 5.5 led all five cities this month. All five cities recorded double-digit year-over-year growth. Bonita Springs and Naples were the only two cities where showings per listing slipped month over month, Bonita from 3.1 to 2.7 and Naples from 3.5 to 3.1.
Mortgage Rates Reversed Direction at 6.53%
The 30-year fixed-rate mortgage averaged 6.53% as of May 28, 2026, per Freddie Mac’s Primary Mortgage Market Survey. That is up from 6.30% at the end of April and below 6.89% a year earlier. The 23-basis-point rise in May reverses a multi-month easing trend.
At May’s median sale prices and 6.53%, a 20%-down conventional loan produces monthly principal and interest of about $1,699 in Fort Myers and $1,877 in Cape Coral. It produces about $2,533 in Estero, $2,790 in Bonita Springs, and $3,145 in Naples. Property taxes, insurance, and HOA dues are additional. The insurance line varies more from property to property in Southwest Florida than buyers in other regions might expect. Roof age, distance to water, and flood-zone designation move premiums enough to matter within the same neighborhood. Rate moves directly affect financed buyers. Because Naples and Bonita Springs have larger upper-end segments, rate moves may affect a smaller share of buyers in those markets than in the lower-priced cities.
The May rate climb coincided with showings per listing easing from 3.4 to 3.2 month over month, a move that is seasonally normal regardless of rates. Because May closings reflect contracts signed weeks earlier, the late-May move is more likely to surface in June than in May closings. Showings stayed well above a year ago in every city, and buyers kept touring and writing contracts even as closings flattened.
Active Listings Fell 22% While New Listings Slowed Further
The standard active listings count combines fresh listings, returning relists, and stale inventory equally. The new listings count includes both first-attempt entries and homes returning to market under new MLS numbers. When relist activity is high, the new-listings count includes a meaningful share of homes returning to market, so the genuinely-fresh portion is smaller than the headline figure suggests.
Regional active inventory dropped to 18,198 homes in May, down 22.0% year over year. Every city recorded a meaningful decline: Fort Myers -25.0%, Cape Coral -28.4%, Estero -27.7%, Bonita Springs -28.7%, Naples -21.2%. The five cities tracked in this series account for 12,453 of those 18,198 active listings (68.4%). The remaining homes sit in surrounding markets that fall within the regional MLS but outside Worthington’s primary five-city coverage area.
New listings reached 3,685 region-wide in May, down 14.6% year over year. The drop was steepest in Bonita Springs (-22.3%) and Cape Coral (-18.7%), and the lightest declines came from Estero (-0.8%) and Naples (-1.3%). Address-level matching against the trailing 12 months of expired, withdrawn, and terminated data shows the new-listing count includes a meaningful share of homes returning to market under new MLS numbers across all five cities, consistent with city relist rates running between 21.7% and 26.6%. So the count of homes truly new to the market is smaller than it looks.
Months of Supply Fell 32% Year Over Year
Months of supply measures how many months it would take to sell through current inventory at the current pace of closings, assuming no new homes hit the market. Six months is the traditional benchmark for a balanced market, though the season and price range matter as much as the headline number in Southwest Florida.
Regional months of supply reached 6.7 in May, down from 9.9 a year ago. That 32.3% drop places the figure modestly above the 5.5 to 6.5 range that defined the pre-COVID Southwest Florida norm. The figure sits well below the post-COVID highs of 10.9 reached in March 2025 and well above the trough of 3.1 reached in November 2022. The market keeps moving toward balance, with the spring season and seasonally lighter inventory both pulling the figure lower.
City-level figures: Fort Myers 6.4 (from 9.8), Cape Coral 5.5 (from 8.6), Estero 4.7 (from 8.2), Bonita Springs 6.1 (from 10.8), Naples 7.0 (from 10.7). Bonita Springs’s 43.5% drop is the steepest in the region. Estero at 4.7 holds the tightest absolute figure.
Every City Holds Competitive Supply at 2.3 Months or Less
Worthington’s analysis goes deeper. MLS months of supply counts every active listing equally, so a home sitting at the same price for 14 months counts the same as a fresh, well-priced listing from last week. Competitive Inventory narrows the pool to listings under 90 days old that are either first attempts or relists that came back with a meaningful price reduction. It sets aside three groups: stale listings 180 or more days on market without a meaningful reduction, older active listings 90 to 179 days on market, and returning listings that came back at the same price or with a cut under 3%. A home canceled at $600,000 and quickly relisted at $595,000 is not truly new inventory, since changing the MLS number does not reset the market’s memory if the price barely changes.
The 6.7 figure above uses a 12-month sales pace. Competitive Months of Supply uses the most recent three-month pace and ranges from 1.4 in Estero to 2.3 in Cape Coral, with Fort Myers at 2.2, Bonita Springs at 1.7, and Naples at 2.1. The full three-part breakdown for each city appears in the city reports. The listings that linger are concentrated at the higher end and among homes that have not yet drawn a buyer at their current asking price.
The Relist Cost Analysis Now Reaches $85,000 in Naples
The relist rate measures what percentage of current active listings have already failed to sell at least once in the past 12 months. It shows how much of today’s active inventory has already been through the market before. Each time a home is relisted, its days on market clock resets to zero. A buyer browsing the active listings cannot see prior listing history without specifically asking.
Regional relist rate sits at 24.1% averaged across the five cities. Fort Myers leads at 26.6%, followed by Bonita Springs at 25.2%, Naples at 24.4%, Cape Coral at 22.8%, and Estero at 21.7%. Roughly one in four active listings across the region is on a second or later attempt to find a buyer.
Relisted Homes Take 4 to 5 Times Longer to Sell
First-attempt median days on market for homes that sold over the past 4 months runs in a tight band of 49 to 61 days across all five cities. Fort Myers 56 days, Cape Coral 49, Estero 61, Bonita Springs 61, Naples 57. The combined median days on market for relisted homes that eventually sold runs 246 to 272 days. Bonita Springs and Estero clock at 272 and 268 respectively, with Naples at 260, Fort Myers at 258, and Cape Coral at 246. Relisted homes that eventually sell take roughly four to five times longer to clear than homes that launch at a price recent sales support. The delay does not come from the final price alone. It comes from the time lost before the price reached the market, plus the reduced attention a listing gets after buyers have already seen it sit.
Naples Sellers Now Hold the Widest Relist Dollar Gap at $85,000
The relist dollar gap is the difference between what sellers originally asked and what they eventually accepted after a previous listing attempt. The median Naples home that relisted and eventually sold closed for $85,000, or 12.3%, below its original asking price. That is the largest dollar gap in Southwest Florida this month. Bonita Springs held that position last month. In May, Naples moved into it.
Bonita Springs follows at $74,900 (13.3% below, the widest percentage gap in the region), Estero at $54,900 (11.1%), Fort Myers at $47,000 (11.8%), and Cape Coral at $39,950 (9.3%). Across all five cities, why homes get relisted traces back to the same pattern. Sellers enter above where similar homes were closing, then accept a lower price after months of accumulated time on market. The dollar cost is highest in cities with higher absolute price points, where the same percentage gap converts to more dollars.
Price Per Square Foot Held Within 1% Year Over Year
Median sale price moves around when the mix of homes closing in a given month changes. More high-priced closings push it up, more lower-priced closings push it down, even when actual home values have not changed. Price per square foot (PPSF) tells you what buyers are paying per square foot of living space. PPSF is a cleaner read on home value than the median price.
Regional median sale price reached $405,000 in May, up 1.2% from $400,000 a year ago and down 3.6% from $420,000 in April 2026. PPSF region-wide was $240, down 0.8% year over year and down 2.0% from $245 in April. The headline median ran in the $400,000 to $420,000 range across the past three months, while PPSF held within $240 to $245. The pattern is value stability with month-over-month fluctuations driven primarily by sales mix shifts.
Fort Myers median sale price came in at $335,000, down 8.3% year over year but up 3.3% month over month. PPSF was $201, down 9.0% year over year. Cape Coral median rose to $370,000, up 2.8% year over year and up 1.0% from April. Naples median sale price reached $620,000, up 1.1% year over year and down 3.9% from April. The single-month median in Naples eased from April’s $645,000 figure as the share of $1.5M-plus closings dropped from April’s higher 21.2% share back toward the city’s more typical level.
Smaller Markets Continue to Need Three-Month Rolling Reads
We use three-month rolling figures for Estero and Bonita Springs because one high-end closing can make a smaller market look stronger or weaker for a single month. Estero’s single-month median sale price came in at $499,450 (down 3.0% YoY), while the three-month rolling median is $505,000 (down 1.9% YoY). Bonita Springs’s single-month median was $550,000 (flat YoY) and its three-month rolling reads at $565,000 (down 0.9% YoY).
The rolling figures average out the volatility from low monthly closing volume in cities that close 175 to 225 homes per month. Three-month rolling PPSF in Estero is $256 (down 6.6% YoY) and in Bonita Springs is $311 (down 3.7% YoY). The rolling read for Bonita Springs DOM is 65 days, flat versus April, against a single-month figure of 72 that would otherwise suggest a meaningful slowdown.
Regional dollar volume of closed sales reached $2.17 billion in May, up 9.6% year over year. Dollar volume measures the total value of all homes sold, not the value of one typical home. Naples grew 20.7% on dollar volume despite the median price moderating, reflecting strong absolute closing volume against the prior year’s softer base. Bonita Springs grew 34.1%. More of the homes that closed in Bonita this month were higher-priced homes, which pushed total dollar volume higher even though the median home value did not rise by 34%. Cape Coral, Estero, and Fort Myers all slipped on dollar volume year over year, with Estero down 5.5%.
Sold-to-List Held Steady While Asking Prices Stay Above Recent Closed Sales
The sold-to-list ratio compares what homes sold for to what they were asking at the time of contract. Worthington uses the most recent list price at time of contract for this calculation.
Regional sold-to-list ratio held at 96% in May, essentially unchanged from a year ago. Sellers received 95% to 98% of their most recent asking price across the region: Fort Myers 96%, Cape Coral 98%, Estero 96%, Bonita Springs 95%, Naples 95%. Cape Coral’s 98% figure is the highest in the region and a one-point gain from April, essentially flat year over year. Final prices landed roughly 2% to 5% below list across the region, the same range as a year ago.
The active-vs-sold PPSF spread compares the median PPSF of homes currently for sale to the median PPSF of homes that have closed over the past 4 months. When the spread is positive, sellers are asking more per square foot than buyers have recently been willing to pay. This is a market-level comparison and does not appraise any specific home.
The two figures look at different time frames. Active asks are a snapshot of what sellers want right now, while sold PPSF reflects what buyers paid over the last 4 months. The spread varies by city. Estero now has the tightest spread at 4.4%. Fort Myers held that position last month. In May, Estero moved into it. Cape Coral sits at 13.7%, Naples at 12.0%, and Bonita Springs at 15.3%, the widest in the region.
Inside Each City by Price Range
Each cell shows how far active asking PPSF runs above or below recent sold PPSF in that price range. A positive number means active sellers are asking above where comparable homes have been clearing. A negative number means active sellers are asking below recent sold comparables, which is unusual.
| City | Under $400K | $400K-$750K | $750K-$1.5M | $1.5M-$3M | Above $3M |
|---|---|---|---|---|---|
| Fort Myers | +4.9% | +1.6% | +4.5% | +7.3% | -2.4% |
| Cape Coral | +7.0% | +3.6% | +7.8% | -2.6% | n/a |
| Estero | +5.1% | +2.5% | -6.9% | +1.1% | n/a |
| Bonita Springs | +13.8% | +8.9% | +17.7% | +30.0% | +25.2% |
| Naples | +7.8% | +3.6% | +6.9% | +5.6% | +15.0% |
Cape Coral’s overall spread reflects different mixes of home types in the active and sold pools. Higher-priced waterfront listings sit against an inland-weighted closed pool. Naples’s wide overall figure is driven mainly by misalignment above $3M. Bonita Springs is the only city in the region with an asking-price gap across multiple price ranges, with spreads above 8% in every range and above 17% above $750K. Estero is the only city with a negative gap in any range, with active listings from $750K to $1.5M priced 6.9% below where comparable homes have actually been clearing.
Price Reductions Continued at the Same Pace
A meaningful price reduction is three percent or more from the original asking price. Anything under two percent is typically cosmetic, made to refresh search visibility rather than to genuinely meet the market.
Across the five cities, the share of active listings that have reduced their asking price at least once runs in the 35% to 45% range, similar to last month. When those reductions still don’t generate offers, listings often expire and return later as relists. That is the path that produces the $39,950 to $85,000 dollar gap captured in the Relist Cost Analysis above.
Shadow Inventory Held Roughly Stable Across the Region
Across the five cities, roughly 11,500 to 12,000 listings have expired, were terminated, or were withdrawn from the market over the past 12 months without returning to the market. We refer to this as Shadow Inventory. Shadow Inventory does not mean these homes are guaranteed to come back. It simply shows how many sellers recently tried to sell, stopped, and have not yet returned. These sellers may decide to return to the market with a new agent or at a new price point.
Public records add a separate read on owner pressure that the MLS does not capture. Lee County lis pendens filings sit above the pre-COVID baseline through 2025 and into 2026, though they remain a small fraction of 2008-era volume. Florida’s homeowners insurance environment affects both sides of the deal. It can influence why some owners decide to sell, and it can change a buyer’s total cost enough to affect whether a contract still works. Those insurance costs run highest on older homes built before 2002 and on Gulf-access waterfront listings.
Worthington Realty Market Lens
The metrics below come from address-level analysis of the active and recent sold pools across all five cities. These metrics surface conditions that standard market reports do not capture. They show how many active listings have already had a previous listing attempt. They also show how long relisted homes ultimately take to clear and where active asking prices sit relative to recent sold prices.
| City | Competitive Months of Supply | Relist Rate | Ask-Bid Gap (PPSF%) | Pending-to-Active Ratio | First-Attempt Median DOM | Relist Combined Median DOM |
|---|---|---|---|---|---|---|
| Fort Myers | 2.2 | 26.6% | 5.7% | 23.8% | 56 | 258 |
| Cape Coral | 2.3 | 22.8% | 13.7% | 30.1% | 49 | 246 |
| Estero | 1.4 | 21.7% | 4.4% | 30.1% | 61 | 268 |
| Bonita Springs | 1.7 | 25.2% | 15.3% | 22.0% | 61 | 272 |
| Naples | 2.1 | 24.4% | 12.0% | 24.1% | 57 | 260 |
Source: FGCMLS via Stellar MLS. Full definitions for each metric are in Worthington’s market methodology. Worthington’s address-level metrics come from a property-level MLS export, a separate dataset from the published monthly counts used for the headline figures, so the active total can differ slightly.
City-Level Snapshots
Fort Myers

- Active Listings: 2,986
- Sold (Last 120 Days): 2,248
- Months of Supply (MLS / Competitive): 6.4 / 2.2
- Median Sold Price: $335,000
- Sellers Received: 96% of asking price
- Relist Rate: 26.6%
- Pending-to-Active Ratio: 23.8%
Fort Myers extended its closing-growth streak to nine consecutive months with closings up 0.8% year over year. Pending sales rose 14.5%, and active inventory fell 25.0% year over year. The relist rate at 26.6% is the highest in the region, reflecting the largest accumulated pool of returning sellers. The active-vs-sold PPSF spread sits at 5.7%, the second-tightest in the region behind Estero. Median PPSF at $201 is down 9.0% year over year, in line with the 8.3% drop in median sale price. The two moving together points to real price softening in Fort Myers, not just a change in which homes sold.
Read the full Fort Myers relist rate report | Search Fort Myers homes for sale
Cape Coral

- Active Listings: 2,759
- Sold (Last 120 Days): 2,221
- Months of Supply (MLS / Competitive): 5.5 / 2.3
- Median Sold Price: $370,000
- Sellers Received: 98% of asking price
- Relist Rate: 22.8%
- Pending-to-Active Ratio: 30.1%
Cape Coral closings fell 13.4% year over year in May, the region’s only single-month closing decline. Showings per listing reached 5.5, up 48.6% YoY, the most of the five cities. Sold-to-list rose to 98%, the highest in the region. Median DOM dropped to 44 days, and pending sales rose 18.8% year over year. First-attempt closings cleared in a 49-day median. The relist rate at 22.8% is the second-lowest of the five cities.
Read the full Cape Coral pending sales report | Search Cape Coral homes for sale
Estero

- Active Listings: 586
- Sold (Last 120 Days): 679
- Months of Supply (MLS / Competitive): 4.7 / 1.4
- Median Sold Price: $499,450 (3-mo rolling: $505,000)
- Sellers Received: 96% of asking price
- Relist Rate: 21.7%
- Pending-to-Active Ratio: 30.1%
Estero holds the tightest Competitive Months of Supply in the region at 1.4 against the lowest relist rate at 21.7%. The active-vs-sold PPSF spread at 4.4% is now the tightest in the region. Three-month rolling closings are up 28.0% year over year and three-month rolling pending is up 21.5%. The single-month pending figure of 114 came in essentially flat against a high May 2025 base, but the trailing pace continues to run well above the regional average. Closings rose 9.1% year over year in May, the ninth consecutive month of year-over-year growth.
Read the full Estero ask-bid gap report | Search Estero homes for sale
Bonita Springs
- Active Listings: 958
- Sold (Last 120 Days): 874
- Months of Supply (MLS / Competitive): 6.1 / 1.7
- Median Sold Price: $550,000 (3-mo rolling: $565,000)
- Sellers Received: 95% of asking price
- Relist Rate: 25.2%
- Pending-to-Active Ratio: 22.0%
Bonita Springs extended its closing-growth streak to eleven consecutive months with closings up 20.6% year over year and dollar volume up 34.1%, the largest dollar-volume gain in the region. Months of supply fell 43.5%, the steepest year-over-year drop in the region. The active-vs-sold PPSF spread at 15.3% is the widest in the region, with active asking prices running 17% to 30% above recent sold PPSF from $750K up. The relist gap at $74,900 (13.3% below original ask) is second to Naples on absolute dollars but holds the widest percentage gap in the region.
Read the full Bonita Springs inventory report | Search Bonita Springs homes for sale
Naples

- Active Listings: 5,164
- Sold (Last 120 Days): 3,681
- Months of Supply (MLS / Competitive): 7.0 / 2.1
- Median Sold Price: $620,000
- Sellers Received: 95% of asking price
- Relist Rate: 24.4%
- Pending-to-Active Ratio: 24.1%
Naples closed $1.00 billion in dollar volume in May with closings up 9.3% year over year, extending its closing-growth streak to twelve consecutive months, the longest active streak in the region. Pending sales rose 9.9%. The Relist Cost Analysis shows Naples leading the region on the dollar gap at $85,000 (12.3% below original ask), reflecting the highest absolute price points of any city in the dataset. By price range, the active-vs-sold PPSF spread concentrates above $3M at 15.0%, while the $400K to $750K range sits at just 3.6%.
Read the full Naples closed sales report | Search Naples homes for sale
Frequently Asked Questions
Conditions moved further toward balance. Active inventory fell from 23,335 a year ago to 18,198, and months of supply dropped from 9.9 to 6.7. Competitive Inventory ranges from 1.4 to 2.3 months across the five cities. Sold-to-list ratios held steady, so buyers still have negotiating room on most sales.
The median home sold for 95% to 98% of its most recent list price at contract. Relisted homes that sold closed at 9.3% to 13.3% below original ask, with dollar gaps from $39,950 to $85,000.
May closings came in 13.4% below May 2025, but pending sales rose 18.8%, median DOM dropped to 44 days, and showings reached 5.5. The closing dip is a single-month softening the leading indicators do not yet confirm as a trend.
Recent first-attempt sales cleared in a median of 49 to 61 days across the five cities. A home priced close to recent sales has the best chance at that range, while a price above recent comparables tends to take four to five times longer.
Summer brings a smaller buyer pool but also less competing inventory. Winter brings the snowbird buyer pool back, along with a much larger active supply as relisted, returning, and fresh sellers all enter at the same time. The decision depends on price range, condition, and whether your home would enter as competitive inventory or join the stale pool.
Track the Southwest Florida Market in Real Time
Create a free account to save searches and receive alerts on new listings, price reductions, and status changes for the homes you’re watching across Fort Myers, Cape Coral, Estero, Bonita Springs, and Naples.
The Bottom Line for Southwest Florida
May delivered a mixed read. Active inventory kept shrinking, down 22% year over year, while buyers stayed active: showings rose in every city and pending sales were up 11.6%. Closings held essentially flat, with Cape Coral the only city to decline. The throughline held: homes priced to recent sales moved, and homes priced above them waited.
The Worthington team works with buyers and sellers across all five Southwest Florida cities every week. The data shows the regional shape. Turning it into a decision about your specific home, neighborhood, and timeline is what we do alongside our clients.
Search homes across Southwest Florida →
Schedule a 15-minute conversation to discuss your situation →
All data referenced in Worthington’s market reports draws from the Florida Gulf Coast MLS (FGCMLS via Stellar MLS) unless otherwise noted.
May 2026 Southwest Florida Housing Market Report Series
- Fort Myers Has the Highest Relist Rate in Southwest Florida
- Cape Coral Pending Sales Rose 18.8% Year Over Year
- Estero Ask-Bid Gap Is the Tightest in Southwest Florida
- Bonita Springs Inventory Fell 28.7% Year Over Year
- Naples Closed Sales Grew for the 12th Month in a Row
Worthington MLS Search by City
Fort Myers | Cape Coral | Estero | Bonita Springs | Naples
For a full explanation of the indicators used in this report, see how Worthington Realty analyzes the Southwest Florida housing market.