

Closed dollar volume reached $1.22 billion as showings per listing climbed 30% year over year, the largest jump in the region
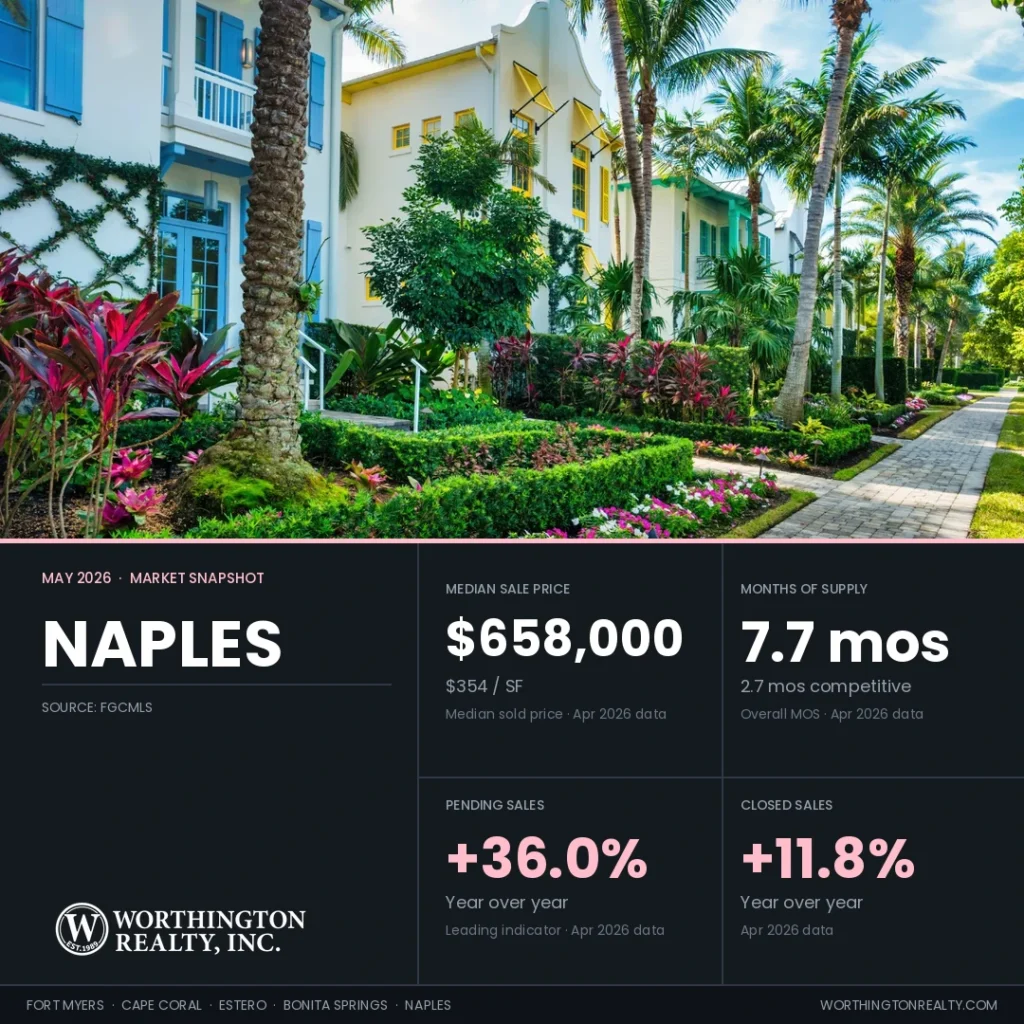
The Naples housing market closed $1.22 billion in dollar volume in April, with closings up 11.8% year over year. Showings per listing rose to 3.5, up from 2.7 a year ago. The headline 9.7% jump in median sale price reflects a higher share of expensive homes closing in April than usual. Closings priced over $1.5M rose from 18.7% in March to 21.2% in April, while price per square foot (PPSF) rose just 2.3% year over year. The active-vs-sold PPSF spread by price range concentrates above $3M at 16.1%. The $400K to $750K range sits at just 3.3%. For regional context across the same data window, see the Southwest Florida housing market update.
Data reflects MLS records as of May 1, 2026. MLS figures may update as late transactions are recorded.
Key Takeaways
- Closed sales reached 966 in April, up 11.8% year over year, the eleventh consecutive month of year-over-year growth and the longest active streak in the region. Dollar volume reached $1.22 billion.
- Showings per listing reached 3.5, up 29.6% year over year, the largest engagement gain in the region.
- Median sale price rose 9.7% to $658,000, but PPSF rose only 2.3% to $354, indicating most of the median jump came from a higher share of expensive homes closing in April rather than actual value gains.
- Competitive Months of Supply is 2.7 against an overall 6.2 (using consistent 3-month closing pace), with active asking PPSF running 16.1% above recent sold PPSF at $3M-plus versus just 3.3% from $400K to $750K.
- The relist dollar gap is $81,500, with relisted homes selling at 11.0% below their original ask after a combined median of 252 days versus 56 days for first-attempt sales.
Regional Snapshot at a Glance
The table below summarizes the headline market metrics for each of the five Southwest Florida cities Worthington tracks, with Naples’s row highlighted. The detailed analysis that follows works through Naples’s metrics in turn.
| City | Median Sold Price | Price/SF | Active Listings | Months of Supply | Sold-to-List | Closed Sales YoY |
|---|---|---|---|---|---|---|
| Fort Myers | $325,000 | $206 | 3,221 | 7.0 | 95.9% | +8.0% |
| Cape Coral | $368,950 | $216 | 2,951 | 5.9 | 97.2% | +7.5% |
| Estero | $532,500 | $263 | 641 | 5.1 | 96.3% | +20.8% |
| Bonita Springs | $575,000 | $317 | 1,067 | 6.9 | 95.9% | +6.7% |
| Naples | $658,000 | $354 | 5,642 | 7.7 | 95.4% | +11.8% |
Source: FGCMLS via Stellar MLS. Single-month data unless otherwise noted. Sold-to-list uses most recent list price at time of contract.
Buyer Engagement Reached Its Largest Year-Over-Year Jump in the Region
Closed sales tell us what buyers decided weeks ago, while pending sales tell us what they are deciding right now.
Naples recorded 966 closed sales in April, up 11.8% from April 2025, the eleventh consecutive month of year-over-year growth and the longest active streak in the region. Dollar volume reached $1.22 billion, the largest single-month dollar volume in any city Worthington tracks.
Pending sales totaled 974 new contracts in April, up 36.0% from a year ago, the second-largest pending-sales increase in the region after Estero. The April Pending-to-Active Ratio of 17.3% (about one new contract per six active listings) sits just below the 17.9% regional average. The trailing three-month pending-to-closed ratio holds above 1.0, meaning more contracts are being signed than closing each month.
New listings totaled 1,074 in April, down 17.1% from 1,296 a year ago. The headline figure overstates the slowdown in genuinely fresh supply, though. We match new listings against the trailing 12 months of expired and withdrawn data at the same address. Some of those April 1,074 are homes returning to market under new MLS numbers after a previous failed attempt. That share is consistent with the city’s 26.1% Re-list Rate on current active listings.
Active Inventory Drained 22.3% Year Over Year as Showings Climbed Almost 30%
April ended with an active inventory of 5,642 homes, down 22.3% from 7,263 a year ago. There are 4,318 Naples listings that expired, were terminated, or were withdrawn from the market over the past 12 months. We refer to this as Shadow Inventory. These sellers may decide to return to the market with a new agent or at a new price point. While not a precise count, Shadow Inventory is a variable to consider against the available supply of homes for sale. Naples has the largest count in the region in absolute terms.
Showings per listing reached 3.5 in April, up 29.6% from 2.7 a year ago, the largest year-over-year engagement increase among the five cities. The 30-year fixed-rate mortgage averaged 6.30% as of April 30, 2026, per Freddie Mac. That is down from 6.46% a month earlier and 6.76% a year ago. At April’s $658,000 median sale price and 6.30%, a 20%-down conventional loan produces about $3,258 in monthly principal and interest. Property taxes, insurance, and HOA dues are additional.
Median Price Jumped 9.7% While PPSF Rose Only 2.3%
Price per square foot (PPSF) tells you what buyers are paying per square foot of living space. PPSF is a cleaner read on home value than the median price. The median sale price moves around when the mix of homes closing in a given month changes.
Naples median sale price reached $658,000 in April, up 9.7% from $599,950 a year ago and up 12.5% from $585,000 in March 2026. Median PPSF was $354, up 2.3% year over year and up 8.6% from $326 in March. The two metrics moved in different directions year over year because the closing mix tilted toward expensive homes more than a typical month. April’s median is the highest reading of the past 12 months, and the past four months ($647K, $650K, $585K, $658K) are running meaningfully higher than the summer and fall 2025 readings, which sat in the $555K to $600K range.
The shift in which homes closed is documented in the data. The $1.5M-plus share of Naples closings grew from 18.7% in March to 21.2% in April. Within that, closings above $3M alone accounted for 8.0% of April closings versus 6.6% in March. The $400K-$750K share dropped from 36.3% in March to 33.6% in April. That shift in the mix of closings explains most of the April median jump.
For homeowners in Naples trying to gauge what their own home is worth, PPSF is the better reference than the median. PPSF has firmed across the past five months, rising from $321 in September to $354 in April. Within most price segments, PPSF is up modestly year over year.
Dollar Volume Slipped 1.3% While Closings Rose 11.8%
Dollar volume (the total dollars exchanged across all closings) reached $1.22 billion in April, down 1.3% year over year despite the 11.8% increase in closing count. The same shift in the mix of closings operates here in the opposite direction. More homes closed, but the average sale price was slightly less favorable than April 2025 once the composition is accounted for.
The April sold-to-list ratio reached 95.4%, up modestly from 95.0% a year ago. Sellers received about 95.4% of their most recent asking price at the closing table, meaning buyers negotiated roughly 4.6% off list. The gap between original asking price and final sale price is substantially wider on relisted homes (see Relist Cost Analysis below).
Price reductions have been recorded on roughly 40% to 45% of currently listed Naples homes, similar to last month.
The Relist Cost Analysis Shows $81,500 in Pricing Misalignment
The Re-list Rate measures what share of currently listed homes have already failed to sell at least once in the past 12 months. It tells us how sellers as a group are responding to current market conditions.
Of the 5,608 Naples active listings in the address-matched analysis set, 1,462 (26.1%) have a prior listing in the trailing 12 months at the same address. Of those 1,462 returning listings, 1,005 came back with a price reduction of 3% or more from their previous attempt. Those are eligible for Competitive Inventory if they are also under 90 days into the current attempt. The remaining 457 returned at the same price or with a reduction under 3%, so they do not count as competitive supply.
The Relist Cost Analysis follows the homes that did eventually sell after one or more failed attempts. Across the past 4 months, sellers in this group originally asked a median of $739,000 and ultimately sold at a median of $657,500. That is an $81,500 gap (11.0% off the original asking price). Combined across all listing attempts, these homes spent a median of 252 days on the market before closing. First-attempt sales cleared in 56 days. The relist process takes about 4.5 times longer to find a buyer than pricing correctly the first time.
The 457 returning listings without a price reduction in Naples’ active pool are concentrated in higher-priced single-family homes. That same accumulated seller resistance shows up in the within-range active-vs-sold PPSF spread of 16.1% above $3M. Buyers shopping the higher Naples ranges should expect the most meaningful negotiating room on listings that returned without a price reduction. Current asking prices on those listings have not adjusted to where comparable homes have actually been clearing.
Competitive Inventory Reduces 6.2 Months of Supply to 2.7
Competitive Inventory strips stale listings and returning listings priced the same as before from the active count. The result reflects the supply that’s actively competing for buyers right now.
Three-part breakdown for Naples:
- Overall months of supply: 6.2 (using a trailing 3-month closing pace of 901 sales/month; the InfoSparks-published figure of 7.7 cited elsewhere uses a 12-month rolling pace)
- Stale-stripped months of supply: 5.1 (after removing 1,042 listings at 180-plus days on market without a meaningful reduction)
- Competitive Months of Supply: 2.7 (after additionally removing stubborn relists and listings 90 to 179 days old; resulting count of 2,461 listings under 90 days that are first-attempt or meaningful relists)
The Active-vs-Sold PPSF Spread Concentrates at $3M-Plus
Naples’ active asking PPSF runs 13.0% above the recent sold PPSF on a blended basis. This compares the median PPSF of homes currently for sale to the median PPSF of homes that have closed over the past 4 months. The two figures look at different time frames. Active asks are a snapshot of what sellers want right now, while sold PPSF reflects what buyers paid over the last 4 months. The spread shows the general direction of pricing, not whether any specific seller is asking too much.
Median active asking PPSF is $385, against $341 median sold PPSF over the past 4 months. By price range, the spread varies sharply. Under $400K, the spread is 8.0%. The $400K to $750K range comes in at just 3.3%, the cleanest segment in the city. From $750K to $1.5M, 9.0%. The $1.5M to $3M tier sits at 5.2%. Above $3M, the spread reaches 16.1%, where active asking prices sit furthest from where comparable homes have been clearing.
Buyers in the $400K to $750K range face asking prices that are aligned with where homes are actually clearing. Buyers above $3M have meaningful room to write below ask, particularly on listings that returned without a price reduction.
Worthington Realty Market Lens
The metrics below come from address-level analysis across all five cities. Naples’s row is highlighted. These metrics surface conditions that standard market reports do not capture. They show how many active listings have already failed to sell once before. They also show how long relisted homes ultimately take to clear and where active asking prices sit relative to recent sold prices.
| City | Competitive Months of Supply | Re-list Rate | Ask-Bid Gap (PPSF%) | Pending-to-Active Ratio | First-Attempt Median DOM | Relist Combined Median DOM |
|---|---|---|---|---|---|---|
| Fort Myers | 2.7 | 28.1% | 5.1% | 18.5% | 54 | 249 |
| Cape Coral | 2.7 | 24.6% | 14.3% | 21.1% | 51 | 246 |
| Estero | 2.0 | 23.0% | 5.7% | 25.4% | 59 | 258 |
| Bonita Springs | 2.4 | 26.7% | 14.0% | 17.7% | 56 | 258 |
| Naples | 2.7 | 26.1% | 13.0% | 17.3% | 56 | 252 |
Source: FGCMLS via Stellar MLS. Single-month data for Pending-to-Active Ratio. Re-list Rate, Ask-Bid Gap, DOM split, and Competitive Months of Supply use a 4-month sold population against the current active snapshot.
Closed Comparables Are Setting the Pace in Naples Featured Communities
The six Worthington-tracked Naples communities span the city’s product range. They run from Lely Resort’s $399,000 OLE coach homes to Grey Oaks Estuary closings in the $9 million range. The community-level data this cycle shows just how differently Naples sub-communities are selling. Pending-to-active ratios run from 20.3% at Pelican Bay to 87.5% at Grey Oaks, where 14 contracts are pending against 16 active listings.
Lely Resort

- Active Listings: 145
- Sold (Last 120 Days): 93
- Homes Pending: 32
- Pending-to-Active Ratio: 22.1%
- Previously Listed Share of Active: 24.8%
- Months of Inventory: 6.2
- Median Sold Price: $745,000
- Sellers Received: 94.5% of asking price
Lely Resort is a buyer’s market across most of its product range at 6.2 months of supply and a 22.1% pending-to-active ratio. The OLE and GreenLinks sub-communities account for 47 of the 145 currently active listings at median asks of $399,000 and $469,000. Those active listings are sitting on the market 110 to 119 days. Over the past 4 months, OLE produced 11 closings at a $400,000 median. The double-gated estate sub-communities (Classics Plantation Estates, Lakoya, and Majors) delivered 13 of 93 closings at medians ranging from $1,575,000 to $2,100,000, with significantly shorter market times. The community-wide $745,000 median masks both ends of that range. Pricing decisions at Lely should reference recent sales within the specific sub-community at any price point. In OLE and GreenLinks, current sellers should expect a long time on market given the volume of similar inventory available.
Search Lely Resort homes for sale
The Vineyards
- Active Listings: 87
- Sold (Last 120 Days): 65
- Homes Pending: 26
- Pending-to-Active Ratio: 29.9%
- Previously Listed Share of Active: 19.5%
- Months of Inventory: 5.4
- Median Sold Price: $820,000
- Sellers Received: 95.2% of asking price
Single-family homes and condo/coach home product at The Vineyards are selling at very different paces. Over the past 4 months, single-family closings in Tierra Lago, Hammock Isles, Terracina, and Valley Oak settled at medians from $1,200,000 to $2,325,000. Days on market ran from 18 to 59 across those neighborhoods. Condo and coach home closings cleared at lower prices and slower pace. Avellino Isles had 5 closings at a $1,050,000 median over 78 days. Vista Pointe had 8 closings at $825,000 over 45 days, and Regency Reserve 7 at $610,000 over 152 days. The 87 currently active listings are concentrated in the condo and coach home neighborhoods and have been on the market a median of 105 days. Buyers targeting condo and coach home product have substantial selection.
Search The Vineyards homes for sale
Esplanade Golf and Country Club

- Active Listings: 36
- Sold (Last 120 Days): 28
- Homes Pending: 15
- Pending-to-Active Ratio: 41.7%
- Previously Listed Share of Active: 16.7%
- Months of Inventory: 5.1
- Median Sold Price: $1,702,500
- Sellers Received: 95.5% of asking price
Currently active and recent closed pools at Esplanade are made up of very different homes this cycle. The 28 closings over the past 4 months were concentrated in 3+den and 4+den larger single-family homes (median 3,045 sqft) at a $1,702,500 median. The 36 currently active listings average 2,102 sqft and concentrate in 2+den and 2-bed product, producing a $774,000 active median ask. Twenty of the 36 active listings are priced below $800,000, against just 3 of 28 closings in that range. Golf membership type is the essential due-diligence item here. Full bundled golf and social-only memberships coexist in this community. The price patterns visible across the active pool reflect that distinction. Sellers in the larger single-family segment are clearing at 95.5% of asking.
Search Esplanade Golf and Country Club homes for sale
Isles of Collier Preserve

- Active Listings: 73
- Sold (Last 120 Days): 53
- Homes Pending: 27
- Pending-to-Active Ratio: 37.0%
- Previously Listed Share of Active: 30.1%
- Months of Inventory: 5.5
- Median Sold Price: $1,495,000
- Sellers Received: 96.0% of asking price
At Isles of Collier Preserve, the current active median ask of $995,000 and the closed median of $1,495,000 over the past 4 months look far apart at first glance. That difference comes from the mix of homes currently listed versus those that recently sold. At the individual listing level, pricing is closely aligned with recent sales. A 30.1% relist share indicates returning sellers who have already gone through one or more failed listing attempts. Those sellers are now priced where comparable homes are clearing. The 37.0% pending-to-active ratio with 27 contracts pending against 73 currently active points to continued demand at this preserve-focused community four miles from downtown Naples. Closings cleared at a 39-day median across 53 sales over the past 4 months, a fast pace. Current list prices are aligned with where homes have actually been clearing. Sellers who priced accurately from the start are finding buyers quickly.
Search Isles of Collier Preserve homes for sale
Pelican Bay
- Active Listings: 212
- Sold (Last 120 Days): 138
- Homes Pending: 43
- Pending-to-Active Ratio: 20.3%
- Previously Listed Share of Active: 24.1%
- Months of Inventory: 6.1
- Median Sold Price: $1,612,500
- Sellers Received: 94.6% of asking price
Pelican Bay’s community-wide figures need to be split by sub-community before they are useful. Over the past 4 months, Bay Colony generated 20 of 138 closings at a $4,450,000 median. There are 28 currently active Bay Colony listings at a $4,972,500 median ask. The remaining 118 closings cleared at a $1,475,000 median in 49 days, against 184 currently active non-Bay Colony listings at a $1,250,000 median ask. The current active inventory has been on the market a median of 105 days, while non-Bay Colony sales are closing in roughly half that time. A 94.6% sold-to-list ratio reflects active negotiation across the price spectrum. Buyers in either segment should work from sales within their target price range; the community-wide $1,612,500 median spans two very different product types.
Search Pelican Bay homes for sale
Grey Oaks

- Active Listings: 16
- Sold (Last 120 Days): 16
- Homes Pending: 14
- Pending-to-Active Ratio: 87.5%
- Previously Listed Share of Active: 18.8%
- Months of Inventory: 4.0
- Median Sold Price: $4,180,000
- Sellers Received: 96.7% of asking price
In Grey Oaks, 14 contracts went pending against 16 currently active listings. A pending-to-active ratio of 87.5% shows genuine market activity at the high end. With only 16 closings over the past 4 months, a single sale can move the community median. Buyers and sellers here should rely on recent sales within the specific sub-community. A $9,000,000 Estuary closing after 524 days and a $7,000,000 Isle Royale sale after 257 days are in the data and skew the community figure upward. The Estates at Grey Oaks had 5 closings at a $6,000,000 median in just 14 days. Venezia had 3 closings at $3,850,000 and Terra Verde 2 at $1,750,000 in under a week each. Buyers evaluating Estuary listings should reference Estuary-specific sales rather than the community median, which spans more than $7 million across the past 4 months.
Search Grey Oaks homes for sale
Frequently Asked Questions
Buyers face two distinct conditions. From $400K to $750K, active asking PPSF is just 3.3% above recent sold PPSF, leaving limited negotiating room. Above $3M, the spread is 16.1%, with 457 returning listings without a price reduction offering room to write below ask.
The rise reflects a higher share of expensive homes closing in April than usual rather than broad value appreciation. The $1.5M-plus share of closings rose from 18.7% in March to 21.2% in April. PPSF rose only 2.3% year over year, which is closer to where Naples values actually moved.
The April sold-to-list ratio came in at 95.4%, meaning the median home sold for about 4.6% below its most recent listed price. The median relisted home sold at $81,500 (11.0%) below original ask after 8.4 months of combined market exposure. The $400K to $750K range is the cleanest segment at 3.3%. Above $3M, active asking prices run 16.1% above recent solds. Buyers should anchor offers to recent sold prices on similar homes rather than current asking prices, especially in the upper price ranges.
First-attempt listings priced right and presented well sold in a median of 56 days. Relisted homes that eventually sold took 252 days combined across all attempts, roughly 4.5 times longer.
Naples accounts for $1.22 billion of the regional $2.53 billion in dollar volume. Pending sales growth of 36.0% is second to Estero’s 56.7%. Closing growth of 11.8% is above the regional 6.4%.
Track the Naples Market in Real Time
Create a free account to save searches and receive alerts on new listings, price reductions, and status changes for the homes you’re watching.
Final Thoughts
April closed with Naples leading the region on absolute dollar volume and on engagement per listing. The headline 9.7% median jump came from a closing mix tilted toward higher-priced homes this month. PPSF rose only 2.3% year over year, which is closer to where Naples values actually moved.
What This Means for Buyers and Sellers
For buyers, the read divides cleanly by price range. Homes from $400K to $750K are closely aligned with recent sales. Homes above $3M offer meaningful negotiating room, particularly on the 457 returning listings without a price reduction. For sellers, pricing within the recent comparable sale range is delivering buyers in 56 days. Homes reaching meaningfully above that range are spending roughly 4.5 times longer on the market before eventually selling at $81,500 below their original asking price.
The Worthington team works with buyers and sellers across Naples neighborhoods every week. That includes Pelican Bay, Grey Oaks, Lely Resort, Gulf Shore Drive, and the broader Naples area. Reading the data is one part of the work. Using it to value a specific home or write a specific offer is what we do alongside our clients.
Schedule a 15-minute conversation to discuss your situation →
Most homeowners feel overwhelmed when it’s time to move. At Worthington Realty, we provide personalized guidance and clear communication so that you feel heard, valued, and confident in your decisions.
All data referenced in Worthington’s market reports draws from the Florida Gulf Coast MLS (FGCMLS via Stellar MLS) unless otherwise noted.
May 2026 Southwest Florida Housing Market Report Series
- Southwest Florida Housing Market Update
- Fort Myers Housing Market Update
- Cape Coral Housing Market Update
- Estero Housing Market Update
- Bonita Springs Housing Market Update
Worthington MLS Search by City
Fort Myers | Cape Coral | Estero | Bonita Springs | Naples
For a full explanation of the indicators used in this report, see how Worthington Realty analyzes the Southwest Florida housing market.