

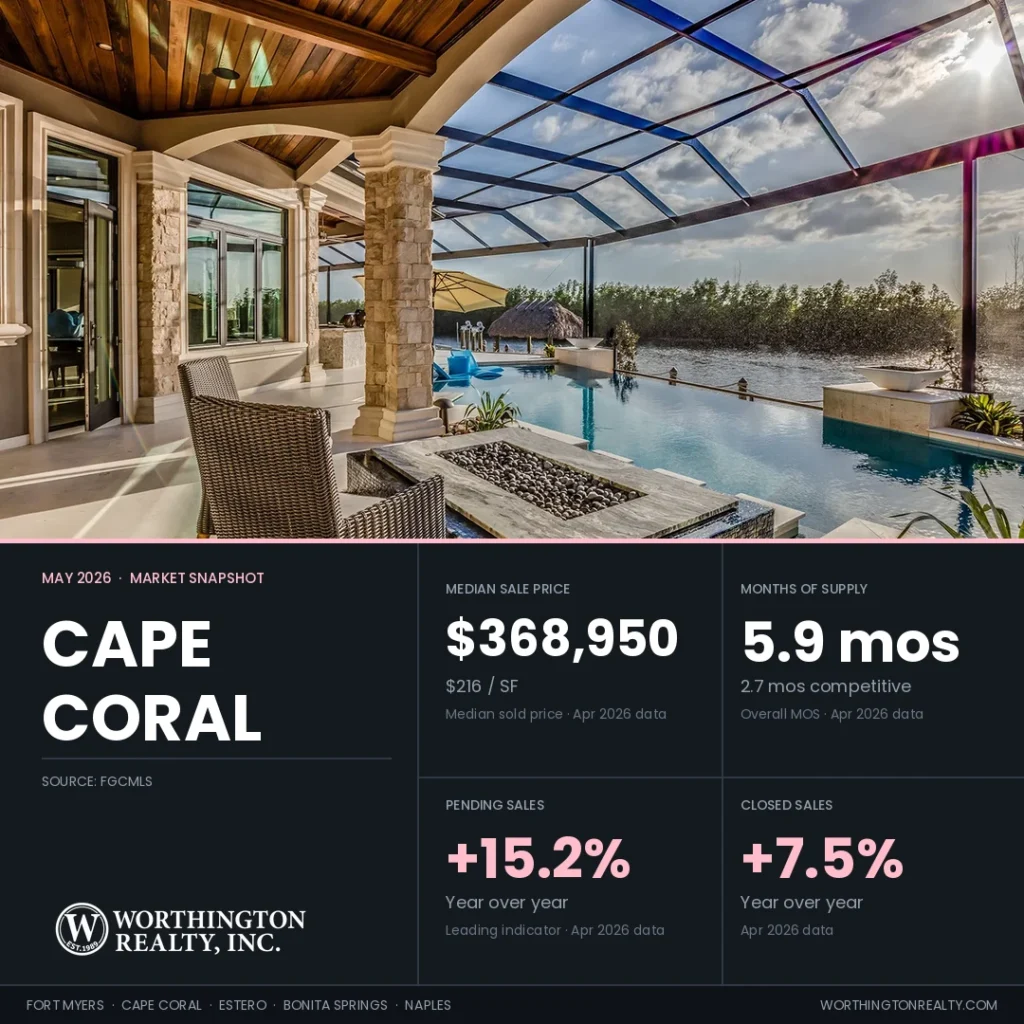
Cape Coral led Southwest Florida on buyer activity with 4.9 showings per listing
The Cape Coral housing market produced more buyer activity per listing than any other city in the region in April. Showings per listing reached 4.9, up from 3.9 a year ago, the highest in any of Worthington’s five Southwest Florida markets. Closed sales rose 7.5% year over year and dollar volume grew 10.1%. Active asking prices per square foot (PPSF) run 14.3% above recent solds on a blended basis, the widest active-vs-sold PPSF spread in Southwest Florida. Most of that spread reflects mix. The active pool and the recent sold pool are made up of different home types, with high-priced waterfront active inventory sitting against a closed pool weighted toward inland resale. When you group homes by price range, asking and sold prices are more closely aligned. For regional context across the same data window, see the Southwest Florida housing market update.
Data reflects MLS records as of May 1, 2026. MLS figures may update as late transactions are recorded.
Key Takeaways
- Closed sales reached 589 in April, up 7.5% year over year, accelerating from essentially flat in March (-0.7%).
- Active inventory fell to 2,951, down 27.1% year over year, with months of supply dropping from 9.0 to 5.9.
- Showings per listing reached 4.9, up 25.6% year over year, the highest level of any city in Southwest Florida.
- The Re-list Rate is 24.6%, the second-lowest among Worthington’s tracked cities (after Estero at 23.0%), with 716 returning relists in the active pool.
- Competitive Months of Supply is 2.7 against an overall 5.3 (using consistent 3-month closing pace). Active asking PPSF runs 14.3% above recent sold PPSF on a blended basis but stays within −1% to 8% across individual price ranges.
Regional Snapshot at a Glance
The table below summarizes the headline market metrics for each of the five Southwest Florida cities Worthington tracks, with Cape Coral’s row highlighted. The detailed analysis that follows works through Cape Coral’s metrics in turn.
| City | Median Sold Price | Price/SF | Active Listings | Months of Supply | Sold-to-List | Closed Sales YoY |
|---|---|---|---|---|---|---|
| Fort Myers | $325,000 | $206 | 3,221 | 7.0 | 95.9% | +8.0% |
| Cape Coral | $368,950 | $216 | 2,951 | 5.9 | 97.2% | +7.5% |
| Estero | $532,500 | $263 | 641 | 5.1 | 96.3% | +20.8% |
| Bonita Springs | $575,000 | $317 | 1,067 | 6.9 | 95.9% | +6.7% |
| Naples | $658,000 | $354 | 5,642 | 7.7 | 95.4% | +11.8% |
Source: FGCMLS via Stellar MLS. Single-month data unless otherwise noted. Sold-to-list uses most recent list price at time of contract.
Buyer Demand Pushed to a Multi-Year High
Closed sales tell us what buyers decided weeks ago, while pending sales tell us what they are deciding right now.
Cape Coral recorded 589 closed sales in April, up 7.5% from April 2025, accelerating from essentially flat in March (-0.7%). Pending sales reached 622 new contracts in April, up 15.2% from a year ago. That is the smallest pending-growth figure among the five cities but still meaningful. The April Pending-to-Active Ratio of 21.1% sits modestly above the 17.9% regional average. About one new contract per five active listings.
Showings per listing reached 4.9 in April, up from 3.9 a year ago (a 25.6% increase). The average Cape Coral home is getting more buyer attention than any other city in the region. The median home now goes under contract after just 6 showings, down from 9 a year ago. Buyers are touring with more conviction this spring, deciding faster.
New listings totaled 824 in April, down 13.3% from a year ago. The headline figure overstates the slowdown in genuinely fresh supply, though. We match new listings against the trailing 12 months of expired and withdrawn data at the same address. Some of those April 824 are homes returning to market under new MLS numbers after a previous failed attempt. That share is consistent with the city’s 24.6% Re-list Rate on current active listings.
Inventory Drained 27.1% Year Over Year, Second Only to Estero
April ended with an active inventory of 2,951 homes, down 27.1% from 4,047 a year ago. That is the second-largest year-over-year inventory decline in the region after Estero. There are 2,986 Cape Coral listings that expired, were terminated, or were withdrawn from the market over the past 12 months. We refer to this as Shadow Inventory. These sellers may decide to return to the market with a new agent or at a new price point. While not a precise count, Shadow Inventory is a variable to consider against the available supply of homes for sale. The Cape Coral count appears roughly stable from last month.
The 30-year fixed-rate mortgage averaged 6.30% as of April 30, 2026, per Freddie Mac. That is down from 6.46% a month ago and 6.76% a year ago. At April’s $368,950 median sale price and 6.30%, a 20%-down conventional loan produces about $1,827 in monthly principal and interest. Property taxes, insurance, and HOA dues are additional.
Price Per Square Foot Held Within 1.4% of a Year Ago
Price per square foot (PPSF) tells you what buyers are paying per square foot of living space. PPSF is a cleaner read on home value than the median price. The median sale price moves around when the mix of homes closing in a given month changes.
Cape Coral median sale price came in at $368,950 in April, essentially flat against $369,000 a year ago and up 4.9% from $351,750 in March 2026. Median PPSF was $216, down 1.4% year over year and up 4.3% from $207 in March. Both metrics have held within a tight band for the past 12 months. Median sale price has bounced between $350,000 and $375,000, and PPSF has held within $204 to $221 since last spring. Cape Coral homeowners can read this as broad value stability over the past 12 months.
Dollar volume (the total dollars exchanged across all closings) reached $270 million, up 10.1% year over year, behind Estero (+28.0%) and Bonita Springs (+10.5%) for top growth in the region. With closings up 7.5% and dollar volume up 10.1%, average sale price rose modestly versus April 2025, in line with the near-flat PPSF reading.
The April sold-to-list ratio came in at 97.2%, the highest in the region, down marginally from 97.4% a year ago. Sellers received about 97.2% of their most recent asking price at the closing table, meaning buyers negotiated roughly 2.8% off list. The gap between original asking price and final sale price is wider when prior listing attempts are included; the Relist Cost Analysis below shows the spread.
Price reductions have been recorded on roughly 35% to 40% of currently listed Cape Coral homes, similar to last month. When those reductions still don’t generate offers, listings often expire and return later as relists.
The Relist Cost Analysis Shows $44,500 in Pricing Misalignment
The Re-list Rate measures what share of currently listed homes have already failed to sell at least once in the past 12 months. It tells us how sellers as a group are responding to current market conditions.
Of the 2,909 Cape Coral active listings in the address-matched analysis set, 716 (24.6%) have a prior listing in the trailing 12 months at the same address. Cape Coral has the second-lowest Re-list Rate in the region after Estero (23.0%). A smaller share of Cape Coral sellers have already gone through a failed listing attempt than in Fort Myers (28.1%) or Bonita Springs (26.7%). Of those 716 returning listings, 453 came back with a price reduction of 3% or more from their previous attempt. Those are eligible for Competitive Inventory if they are also under 90 days into the current attempt. The remaining 263 returned at the same price or with a reduction under 3%, so they do not count as competitive supply.
Relisted Homes Sold $44,500 Below Original Ask After 4.8× the Market Time
The Relist Cost Analysis follows the homes that did eventually sell after one or more failed attempts. Across the past 4 months, sellers in this group originally asked a median of $454,500 and ultimately sold at a median of $410,000. That is a $44,500 gap (9.8% off the original asking price). Combined across all listing attempts, these homes spent a median of 246 days on the market before closing. First-attempt sales cleared in 51 days. The relist process takes 4.8 times longer to find a buyer than pricing correctly the first time.
The 263 returning listings without a price reduction in Cape Coral’s active pool are largely concentrated on Gulf-access waterfront and saltwater canal homes. In those segments, sellers continue to test pricing meaningfully above where the market has actually been clearing. Buyers shopping waterfront should expect more negotiating room than the asking price suggests. Use recent sold prices as the reference point when writing offers. Active asking prices are running ahead of where homes have been clearing.
Competitive Inventory Reduces 5.3 Months of Supply to 2.7
Competitive Inventory strips stale listings and returning listings priced the same as before from the active count. The result reflects the supply that’s actively competing for buyers right now.
Three-part breakdown for Cape Coral:
- Overall months of supply: 5.3 (using a trailing 3-month closing pace of 550 sales/month; the InfoSparks-published figure of 5.9 cited elsewhere uses a 12-month rolling pace)
- Stale-stripped months of supply: 4.4 (after removing 469 listings at 180-plus days on market without a meaningful reduction)
- Competitive Months of Supply: 2.7 (after additionally removing stubborn relists and listings 90 to 179 days old; resulting count of 1,473 listings under 90 days that are first-attempt or meaningful relists)
The 14.3% Ask-Bid Gap Reflects a Different Mix of Active and Sold Homes
Cape Coral’s active asking PPSF runs 14.3% above the recent sold PPSF on a blended basis, the widest such spread in the region. This compares the median PPSF of homes currently for sale to the median PPSF of homes that have closed over the past 4 months. The two figures look at different time frames. Active asks are a snapshot of what sellers want right now, while sold PPSF reflects what buyers paid over the last 4 months. The spread shows the general direction of pricing, not whether any specific seller is asking too much.
Under $400K, the spread is 8.3%. The $400K to $750K range comes in at 5.6%, and $750K to $1.5M at 6.4%. Above $1.5M (a thin sample of 30 closings against 87 active), the spread is essentially zero (slightly negative at −1.3%).
The blended 14.3% reflects a higher-priced active pool concentrated on Gulf-access and saltwater-canal homes against a closed mix weighted toward inland resale. When you group homes by price range, asking and sold prices are more closely aligned than the blended figure suggests.
Cape Coral’s pricing alignment is closer to Fort Myers than to Bonita Springs. The wider blended figure stems from different home types in the active and sold pools. The 263 returning listings without a price reduction account for most of the wider blended spread.
The April Pending-to-Active Ratio of 21.1% puts Cape Coral modestly above the regional middle, with new contracts forming at a steady pace through April.
Worthington Realty Market Lens
The metrics below come from address-level analysis across all five cities. Cape Coral’s row is highlighted. These metrics surface conditions that standard market reports do not capture. They show how many active listings have already failed to sell once before. They also show how long relisted homes ultimately take to clear and where active asking prices sit relative to recent sold prices.
| City | Competitive Months of Supply | Re-list Rate | Ask-Bid Gap (PPSF%) | Pending-to-Active Ratio | First-Attempt Median DOM | Relist Combined Median DOM |
|---|---|---|---|---|---|---|
| Fort Myers | 2.7 | 28.1% | 5.1% | 18.5% | 54 | 249 |
| Cape Coral | 2.7 | 24.6% | 14.3% | 21.1% | 51 | 246 |
| Estero | 2.0 | 23.0% | 5.7% | 25.4% | 59 | 258 |
| Bonita Springs | 2.4 | 26.7% | 14.0% | 17.7% | 56 | 258 |
| Naples | 2.7 | 26.1% | 13.0% | 17.3% | 56 | 252 |
Source: FGCMLS via Stellar MLS. Single-month data for Pending-to-Active Ratio. Re-list Rate, Ask-Bid Gap, DOM split, and Competitive Months of Supply use a 4-month sold population against the current active snapshot.
Closed Comparables Are Setting the Pace in Cape Coral Featured Communities
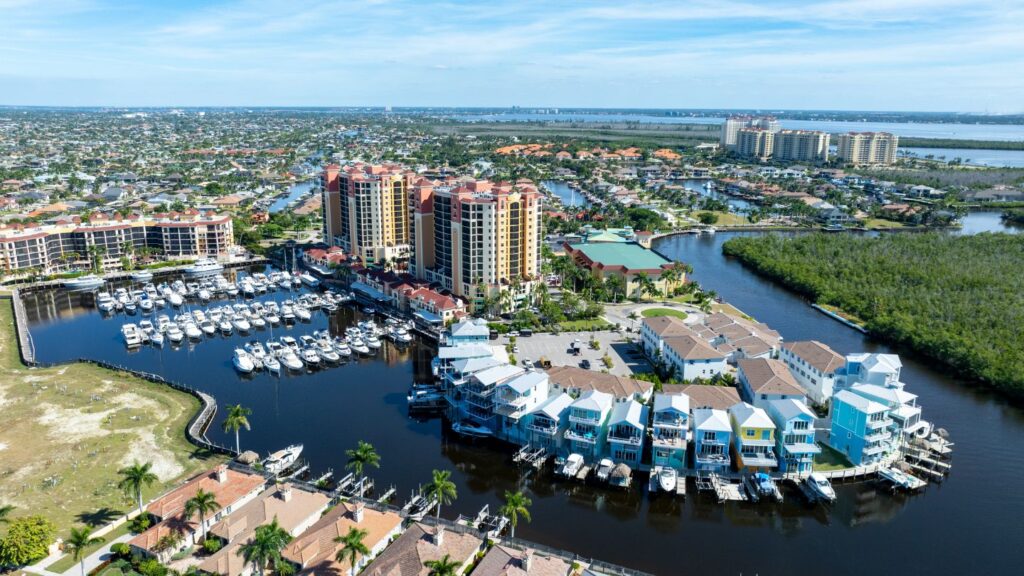
The five Worthington-tracked Cape Coral communities span the city’s product range from inland single-family at Sandoval to Gulf-access waterfront at Cape Harbour and Tarpon Point. The 2.7-month citywide Competitive Inventory figure masks the variation between these neighborhoods this cycle. Community-level inventory ranges from Sandoval’s 2.6 months to Cape Harbour’s 9.1 months.
Cape Harbour
- Active Listings: 34
- Sold (Last 120 Days): 15
- Homes Pending: 5
- Pending-to-Active Ratio: 14.7%
- Previously Listed Share of Active: 29.4%
- Months of Inventory: 9.1
- Median Sold Price: $525,000
- Sellers Received: 92.4% of asking price
A pending-to-active ratio of 14.7% and 9.1 months of supply describe a slow market at Cape Harbour this cycle. The 34 currently active listings have been on the market a median of 141 days. Of the 15 closings over the past 4 months, 14 were in the Cape Harbour core. Those cleared in 87 days at a $512,500 median. The remaining sale was a $2,750,000 closing in Harbour Preserve. The 92.4% sold-to-list ratio indicates buyers and sellers are negotiating significantly off list price. Harbour Preserve’s 3 active estate listings are asking a $3,400,000 median against that single comparable closing. Buyers willing to negotiate from recent sales are operating in a market where sellers have signaled flexibility.
Search Cape Harbour homes for sale
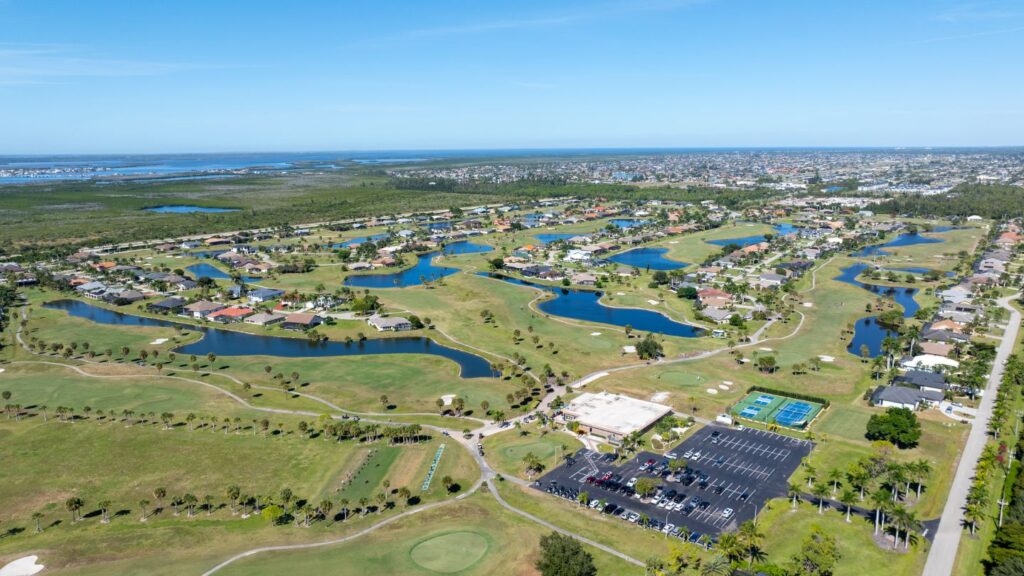
Cape Royal
- Active Listings: 11
- Sold (Last 120 Days): 11
- Homes Pending: 3
- Pending-to-Active Ratio: 27.3%
- Previously Listed Share of Active: 36.4%
- Months of Inventory: 4.0
- Median Sold Price: $610,000
- Sellers Received: 97.0% of asking price
In Cape Royal, only 11 closings have happened over the past four months. That thin a sample lets any single sale move the community figures. Buyers and sellers should rely on recent sales of the specific home type and street rather than the community median. Within those limits, the picture is steady. Cape Royal proper closed 8 sales at a $602,500 median in 41 days. Royal Tee Country Club Estates had 3 closings at a $610,000 median in just 14 days. The Royal Tee currently active pool of 2 listings is asking $1,267,000 median against the recent $610,000 sale range, with both listings on the market over 4 months. A 36.4% relist share confirms that homes priced well above the recent sale range tend to come off the market without finding buyers.
Search Cape Royal homes for sale
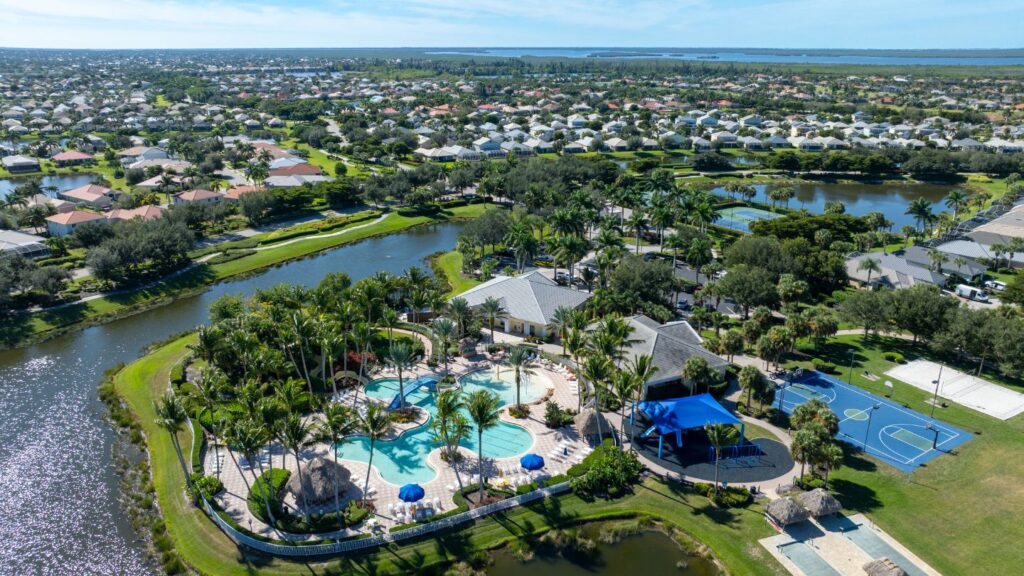
Sandoval
- Active Listings: 26
- Sold (Last 120 Days): 40
- Homes Pending: 15
- Pending-to-Active Ratio: 57.7%
- Previously Listed Share of Active: 34.6%
- Months of Inventory: 2.6
- Median Sold Price: $362,000
- Sellers Received: 95.6% of asking price
Sandoval’s 57.7% pending-to-active ratio and 2.6 months of supply describe an active market this cycle. The community sells at two distinct price points. Over the past 4 months, Somerville carriage homes had 7 closings at a $250,000 median, while Sandoval’s broader single-family product cleared 22 closings at a $392,500 median. Currently active listings split similarly, with 14 single-family at a $450,000 median ask and 3 Somerville carriage at $298,000 median. The 34.6% relist share is high for a community moving inventory this quickly. The 81-day median time on market for active listings suggests homes priced above $500,000 face thinner buyer demand than the lower-priced product. Most sales have been clearing at the lower price points. Sellers pricing at or near recent neighborhood comps are converting. Those listing above $500,000 should prepare for extended marketing.
Search Sandoval homes for sale
Tarpon Point
- Active Listings: 16
- Sold (Last 120 Days): 10
- Homes Pending: 0
- Pending-to-Active Ratio: 0.0%
- Previously Listed Share of Active: 31.2%
- Months of Inventory: 6.4
- Median Sold Price: $911,000
- Sellers Received: 93.8% of asking price
Zero pending contracts against 16 currently active listings stands out at Tarpon Point this cycle. Tarpon Landings has 10 active listings asking a $1,069,950 median. Those have been sitting on the market a median of 177 days. By contrast, 8 Tarpon Landings homes that closed in the past 4 months sold at a $948,500 median in just 64 days. Tarpon Estates has 2 active listings at $2,145,000 median ask with 132 days of accumulated time, and Tarpon Gardens cleared 2 closings at $630,000. The 93.8% sold-to-list ratio indicates buyers negotiating below asking when offers do come in. To sell this cycle, Tarpon Landings sellers should price to the $948,500 range that has actually been clearing. The active asking range above that is producing 177 days on market with no contracts.
Search Tarpon Point homes for sale
Cape Coral Yacht Club
- Active Listings: 18
- Sold (Last 120 Days): 12
- Homes Pending: 2
- Pending-to-Active Ratio: 11.1%
- Previously Listed Share of Active: 50.0%
- Months of Inventory: 6.0
- Median Sold Price: $542,450
- Sellers Received: 93.6% of asking price
In Cape Coral Yacht Club, only 12 closings have happened over the past 4 months. With a sample that thin, individual sales move the community figure: the 12 closings ranged from $225,000 to $3,300,000. Half of the currently active listings have previously failed to sell, with returning sellers sitting on the market a median of 105 days. The closed median of $542,450 sits below the $649,475 active median ask, a $107,000 difference between what is being asked and what has actually been selling. The 93.6% sold-to-list ratio reinforces that buyers are negotiating actively when offers do come in. Pricing here should always be street-level: this non-gated waterfront neighborhood includes vintage rebuilds and custom estates closing in the same four-month window.
Search Cape Coral Yacht Club homes for sale
Frequently Asked Questions
Cape Coral leads the region on buyer activity (4.9 showings per listing) and the sold-to-list ratio (97.2%). First-attempt listings sell at a 51-day median, the fastest in Southwest Florida. Active inventory dropped 27.1% year over year. Expect competition on inland resale and more selection on Gulf-access waterfront, where 263 returning listings without a price reduction offer negotiating opportunities.
The April sold-to-list ratio reached 97.2%, the highest in the region. Buyers are negotiating about 2.8% off the most recent listed price at contract. On the relist pool the spread is wider. The median relisted home sold at $44,500 (9.8%) below its original ask after roughly 8.2 months of combined market exposure.
The blended 14.3% spread is largely mix-driven rather than within-range overpricing. Under $400K, the spread is 8.3%. From $400K to $750K, 5.6%. From $750K to $1.5M, 6.4%. The wider blended figure reflects a higher-priced active pool concentrated on waterfront and Gulf-access homes against a closed mix weighted toward inland resale.
First-attempt listings priced right and presented well sold in a median of 51 days, the fastest pace in the region. Relisted homes that eventually sold took 246 days combined across all attempts, roughly 4.8 times longer than first-attempt sales.
Yes, particularly on older waterfront and saltwater-canal product. Pre-2002 single-family homes and Gulf-access listings frequently produce coverage adjustments during the contract period that materially change the buyer’s annual cost of ownership.
Track the Cape Coral Market in Real Time
Create a free account to save searches and receive alerts on new listings, price reductions, and status changes for the homes you’re watching.
Final Thoughts
Cape Coral was the regional leader on two demand metrics this month: showings per listing (4.9) and sold-to-list ratio (97.2%). The wider blended active-vs-sold PPSF spread reflects mix. Active and recently sold homes are different populations. When you group homes by price range, asking and sold prices are more closely aligned than the headline figure suggests.
What This Means for Buyers and Sellers
For buyers, the 263 returning listings without a price reduction are the clearest path to negotiating room. Those sellers have already proven the market won’t meet their original number. For sellers, Cape Coral’s 97.2% sold-to-list ratio is the regional benchmark for well-priced first-attempt listings clearing close to ask. Pricing within recent comparable sales on the same canal or neighborhood block is what brings buyers in.
The Worthington team works with buyers and sellers across Cape Coral neighborhoods every week. That includes Cape Harbour, Sandoval, Tarpon Point, and the broader Cape Coral area. Reading the data is one part of the work. Using it to value a specific home or write a specific offer is what we do alongside our clients.
Schedule a 15-minute conversation to discuss your situation →
Most homeowners feel overwhelmed when it’s time to move. At Worthington Realty, we provide personalized guidance and clear communication so that you feel heard, valued, and confident in your decisions.
All data referenced in Worthington’s market reports draws from the Florida Gulf Coast MLS (FGCMLS via Stellar MLS) unless otherwise noted.
May 2026 Southwest Florida Housing Market Report Series
- Southwest Florida Housing Market Update
- Fort Myers Housing Market Update
- Estero Real Estate Market Update
- Bonita Springs Housing Market Update
- Naples Housing Market Update
Worthington MLS Search by City
Fort Myers | Cape Coral | Estero | Bonita Springs | Naples
For a full explanation of the indicators used in this report, see how Worthington Realty analyzes the Southwest Florida housing market.