

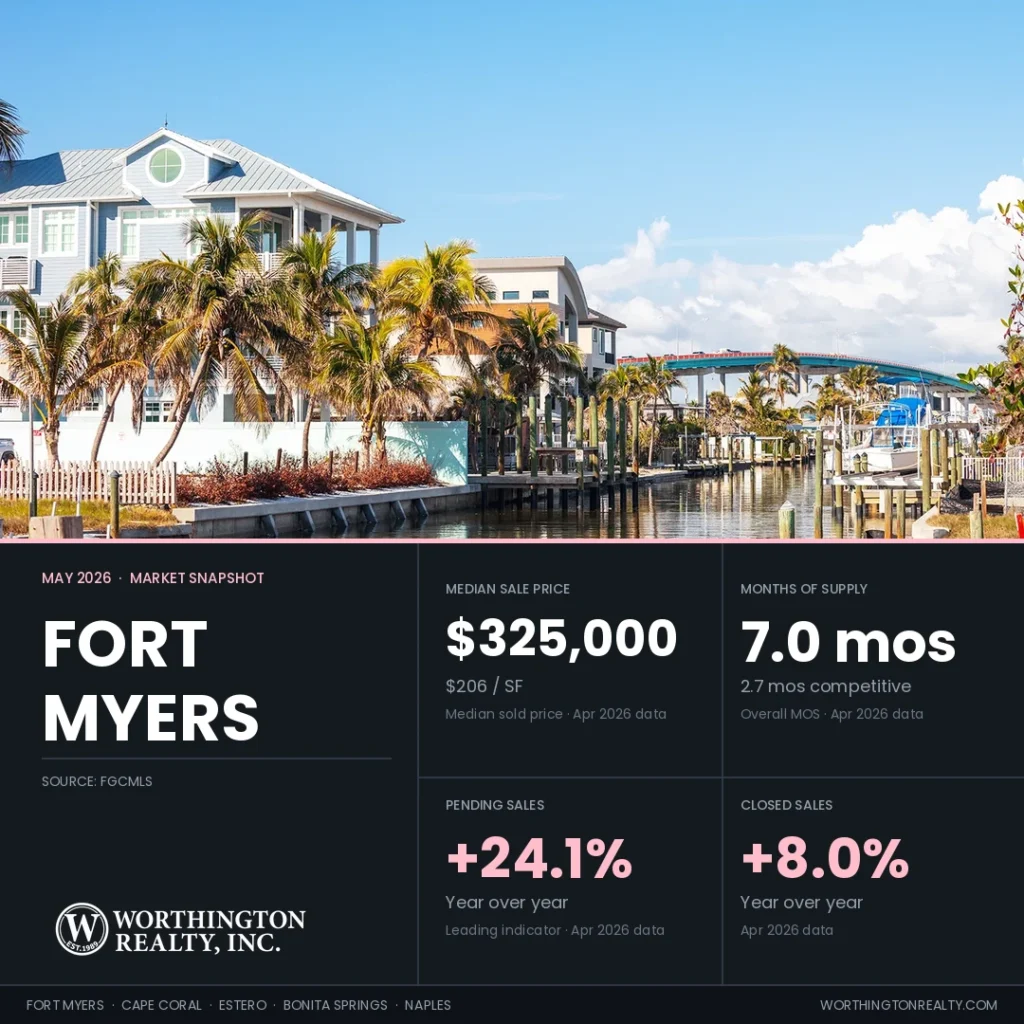
Fort Myers closings hit an eighth consecutive month of growth with asking prices running closest to recent sales in the region
The Fort Myers housing market closed 595 sales in April, up 8.0% from a year ago. Pending sales rose 24.1% to 597. Active inventory dropped 24.7% to 3,221 homes, with months of supply at 7.0 (down from 10.5 a year ago). Active asking prices per square foot (PPSF) run within 5.1% of recent solds. That is the tightest active-vs-sold PPSF spread in any of Worthington’s five Southwest Florida markets this month. The Re-list Rate of 28.1% is the highest in the region. That reflects a sizable pool of returning sellers from prior listing attempts. For regional context across the same data window, see the Southwest Florida housing market update.
Data reflects MLS records as of May 1, 2026. MLS figures may update as late transactions are recorded.
Key Takeaways
- Closed sales reached 595 in April, up 8.0% year over year, the eighth consecutive month of year-over-year growth.
- Active inventory fell to 3,221, down 24.7% year over year, with months of supply dropping from 10.5 to 7.0.
- The Re-list Rate is 28.1%, the highest in the region, with 626 of 3,149 address-matched active listings priced 3% or more below their prior listing.
- The relist dollar gap is $44,000, with relisted homes selling at 11.3% below their original ask after a combined median of 249 days on market versus 54 days for first-attempt sales.
- Competitive Months of Supply is 2.7 against an overall 5.7 (using consistent 3-month closing pace), with the 3.0-month difference representing stale and returning inventory priced unchanged from prior attempts.
Regional Snapshot at a Glance
The table below summarizes the headline market metrics for each of the five Southwest Florida cities Worthington tracks, with Fort Myers’s row highlighted. The detailed analysis that follows works through Fort Myers’s metrics in turn.
| City | Median Sold Price | Price/SF | Active Listings | Months of Supply | Sold-to-List | Closed Sales YoY |
|---|---|---|---|---|---|---|
| Fort Myers | $325,000 | $206 | 3,221 | 7.0 | 95.9% | +8.0% |
| Cape Coral | $368,950 | $216 | 2,951 | 5.9 | 97.2% | +7.5% |
| Estero | $532,500 | $263 | 641 | 5.1 | 96.3% | +20.8% |
| Bonita Springs | $575,000 | $317 | 1,067 | 6.9 | 95.9% | +6.7% |
| Naples | $658,000 | $354 | 5,642 | 7.7 | 95.4% | +11.8% |
Source: FGCMLS via Stellar MLS. Single-month data unless otherwise noted. Sold-to-list uses most recent list price at time of contract.
Closed Sales Returned to Year-Over-Year Growth
Closed sales tell us what buyers decided weeks ago, while pending sales tell us what they are deciding right now.
Fort Myers recorded 595 closed sales in April, up 8.0% over the same month last year. Closings have now grown year over year for eight consecutive months, dating back to September 2025.
Pending sales reached 597 new contracts in April, up 24.1% from a year ago. The April Pending-to-Active Ratio sits at 18.5% (about one new contract per five active listings), close to the regional 17.9% average. More contracts are being signed than are closing each month, based on the trailing three-month average.
New listings totaled 760 in April, down 8.0% from a year ago, the smallest decline among the five cities. The headline figure overstates the slowdown in genuinely fresh supply, though. We match new listings against the trailing 12 months of expired and withdrawn data at the same address. Some of those April 760 are homes returning to market under new MLS numbers after a previous failed attempt. That share is consistent with the city’s 28.1% Re-list Rate on current active listings.
Inventory Drained 24.7% Year Over Year as Showings Climbed
April ended with an active inventory of 3,221 homes, down 24.7% from 4,278 a year ago. There are 2,920 Fort Myers listings that expired, were terminated, or were withdrawn from the market over the past 12 months. We refer to this as Shadow Inventory. These sellers may decide to return to the market with a new agent or at a new price point. While not a precise count, Shadow Inventory is a variable to consider against the available supply of homes for sale. The Fort Myers count appears roughly stable from last month.
Showings per listing reached 3.2 in April, up 14.3% year over year. That is at the lower end of the regional showings-per-listing range, with Cape Coral (4.9), Estero (3.6), and Naples (3.5) all higher.
The 30-year fixed-rate mortgage averaged 6.30% as of April 30, 2026, per Freddie Mac. That is down from 6.46% a month earlier and 6.76% a year ago. At April’s $325,000 median sale price and 6.30%, a 20%-down conventional loan produces about $1,609 in monthly principal and interest. Property taxes, insurance, and HOA dues are additional.
Median Sale Price Slipped While PPSF Held Closer to Stable
Price per square foot (PPSF) tells you what buyers are paying per square foot of living space. PPSF is a cleaner read on home value than the median price. The median sale price moves around when the mix of homes closing in a given month changes.
Fort Myers median sale price reached $325,000 in April, down 11.0% from $365,000 a year ago and 1.4% below the $329,500 March 2026 figure. Median PPSF was $206, down 5.5% year over year and up 1.5% from $203 in March. Both metrics have drifted down across the past 12 months. Median has fallen from $365,000 last April through readings in the $330,000 to $360,000 range, with April’s $325,000 the lowest reading of the past 12 months. The shallower decline on PPSF than on median tells us a closing mix has tilted toward smaller and lower-priced homes. Home values themselves moved much less. PPSF is the better read for a homeowner trying to gauge their own home’s value.
Dollar Volume, Sold-to-List Ratio, and Price Reductions
Dollar volume reached $238 million in April, down 5.5% year over year. Closings rose 8.0% but dollar volume fell, reflecting the same shift toward lower-priced homes visible in the median.
The April sold-to-list ratio reached 95.9%, up from 95.5% a year ago. Sellers received about 95.9% of their most recent asking price at the closing table, meaning buyers negotiated roughly 4.1% off list. That is a normal Florida resale negotiation range. The gap between original asking price and final sale price is materially wider when prior listing attempts are included; the Relist Cost Analysis below quantifies that.
Across the active pool, price reductions have been recorded on roughly 40% of currently listed homes, similar to last month. When those reductions still don’t generate offers, listings often expire and return later as relists. That’s the path that creates the relist dollar gap discussed below.
The Relist Cost Analysis Shows $44,000 in Pricing Misalignment
The Re-list Rate measures what share of currently listed homes have already failed to sell at least once in the past 12 months. It tells us how sellers as a group are responding to current market conditions.
Of the 3,149 Fort Myers active listings in the address-matched analysis set, 885 (28.1%) have a prior listing in the trailing 12 months at the same address. That is the highest Re-list Rate in the region. Of those 885 returning listings, 626 came back with a price reduction of 3% or more from their previous attempt. Those are eligible for Competitive Inventory if they are also under 90 days into the current attempt. The remaining 259 returned at the same price or with a reduction under 3%, so they do not count as competitive supply. Most of the 885 returning sellers (70.7%) have already absorbed at least some price adjustment from their original positions, giving buyers a defined pool to focus on for negotiating room.
Relisted Homes Sold $44,000 Below Original Ask After 4.6× the Market Time
The Relist Cost Analysis follows the homes that did eventually sell after one or more failed attempts. Across the past 4 months, sellers in this group originally asked a median of $469,000 and ultimately sold at a median of $425,000. That is a $44,000 gap (11.3% off the original asking price). Combined across all listing attempts, these homes spent a median of 249 days on the market before closing. First-attempt sales cleared in 54 days. The relist process takes about 4.6 times longer to find a buyer than pricing correctly the first time.
The $44,000 dollar gap is the lowest in the region in absolute dollars, partly because Fort Myers price points are lower than other cities. As a percentage of original ask, Fort Myers’ 11.3% sits in the middle of the regional range (10.0% to 12.6%).
The 259 returning listings without a price reduction are the most actionable read for Fort Myers buyers. These are homes that have come back to market without a meaningful price reduction. The data over the past 4 months shows these listings rarely sell at their current ask. Buyers writing at the recent first-attempt sold range have negotiating room these listings have not yet acknowledged on paper.
Competitive Inventory Reduces 5.7 Months of Supply to 2.7
Competitive Inventory strips stale listings and returning listings priced the same as before from the active count. The result reflects the supply that’s actively competing for buyers right now. The standard active count counts fresh listings, returning relists, and stale inventory equally.
Three-part breakdown for Fort Myers:
- Overall months of supply: 5.7 (using a trailing 3-month closing pace of 555 sales/month; the InfoSparks-published figure of 7.0 cited elsewhere uses a 12-month rolling pace)
- Stale-stripped months of supply: 4.7 (after removing 553 listings at 180-plus days on market without a meaningful reduction)
- Competitive Months of Supply: 2.7 (after additionally removing stubborn relists and listings 90 to 179 days old; resulting count of 1,508 listings under 90 days that are first-attempt or meaningful relists)
Asking Prices the Tightest in the Region
Fort Myers’ active asking PPSF runs 5.1% above the recent sold PPSF on a blended basis. This compares the median PPSF of homes currently for sale to the median PPSF of homes that have closed over the past 4 months. The two figures look at different time frames. Active asks are a snapshot of what sellers want right now, while sold PPSF reflects what buyers paid over the last 4 months. The spread shows the general direction of pricing, not whether any specific seller is asking too much.
Median active asking PPSF is $215, against $205 median sold PPSF over the past 4 months. By price range, the spread is 6.4% under $400K, 1.9% from $400K to $750K, 4.6% from $750K to $1.5M, and 4.6% from $1.5M to $3M.
Fort Myers does not have the kind of overpricing concentration that Bonita Springs or upper Naples shows. The widest spread by price range is 6.4% under $400K, narrower than any range in Bonita Springs.
Worthington Realty Market Lens
The metrics below come from address-level analysis across all five cities. Fort Myers’s row is highlighted. These metrics surface conditions that standard market reports do not capture. They show how many active listings have already failed to sell once before. They also show how long relisted homes ultimately take to clear and where active asking prices sit relative to recent sold prices.
| City | Competitive Months of Supply | Re-list Rate | Ask-Bid Gap (PPSF%) | Pending-to-Active Ratio | First-Attempt Median DOM | Relist Combined Median DOM |
|---|---|---|---|---|---|---|
| Fort Myers | 2.7 | 28.1% | 5.1% | 18.5% | 54 | 249 |
| Cape Coral | 2.7 | 24.6% | 14.3% | 21.1% | 51 | 246 |
| Estero | 2.0 | 23.0% | 5.7% | 25.4% | 59 | 258 |
| Bonita Springs | 2.4 | 26.7% | 14.0% | 17.7% | 56 | 258 |
| Naples | 2.7 | 26.1% | 13.0% | 17.3% | 56 | 252 |
Source: FGCMLS via Stellar MLS. Single-month data for Pending-to-Active Ratio. Re-list Rate, Ask-Bid Gap, DOM split, and Competitive Months of Supply use a 4-month sold population against the current active snapshot.
Closed Comparables Are Setting the Pace in Fort Myers Featured Communities
The six Worthington-tracked Fort Myers communities span a wide price range. Across the six, condo and villa medians start at $275,000 (Lexington Country Club) and single-family medians reach $1.4 million (WildBlue). Closing volume across the six this cycle ranges from 28 (Timber Creek) to 75 (Lexington). What the closed comparables show this month is that pricing to recent sales at the sub-community level matters more than the community-wide median across all six.
Verandah
- Active Listings: 46
- Sold (Last 120 Days): 49
- Homes Pending: 13
- Pending-to-Active Ratio: 28.3%
- Previously Listed Share of Active: 39.1%
- Months of Inventory: 3.8
- Median Sold Price: $450,000
- Sellers Received: 96.0% of asking price
A 39.1% relist share is the lead signal at Verandah. Of the 46 currently active listings, 18 are making a second or later attempt to sell within the past twelve months. Those returning sellers have already spent a median of 95 days into this second attempt without finding buyers, the same time first-attempt homes took to sell. Closings over the past 4 months covered a wide price range. Pebblebrook (8 closings at a $293,000 median) and Cottonwood Bend (5 at $195,000) made up the highest-volume lower-priced neighborhoods. Heritage Preserve closed 3 at $455,000 and Cypress Marsh produced 2 high-end closings at a $1,035,000 median. Heritage Preserve and Lakeview active listings are currently asking above $533,000. That sits well above where Heritage Preserve has been clearing. Sellers who price to recent sales on their own street, rather than to community-wide asking prices, will sell on the first attempt.
Search Verandah homes for sale
The Plantation
- Active Listings: 45
- Sold (Last 120 Days): 47
- Homes Pending: 18
- Pending-to-Active Ratio: 40.0%
- Previously Listed Share of Active: 26.7%
- Months of Inventory: 3.8
- Median Sold Price: $580,000
- Sellers Received: 96.4% of asking price
A 40.0% pending-to-active ratio and 3.8 months of supply describe an active market at The Plantation this cycle. Bridgetown and Somerset are pricing and selling differently. Over the past 4 months, Bridgetown closed 32 of the 47 sales at a $520,000 median in 39 days. Somerset’s 15 closings settled at a $690,000 median over 72 days. Currently active listings split similarly: 24 Bridgetown at $499K median ask, 21 Somerset at $485K. Somerset is taking longer to clear, with active listings sitting on the market 97 days versus Bridgetown’s 62. Buyers seeking a faster pace and lower price points are finding them in Bridgetown. Somerset buyers and sellers are working through a slower, higher-priced segment where pricing close to recent sales matters more.
Search The Plantation homes for sale
Pelican Preserve
- Active Listings: 51
- Sold (Last 120 Days): 72
- Homes Pending: 20
- Pending-to-Active Ratio: 39.2%
- Previously Listed Share of Active: 23.5%
- Months of Inventory: 2.8
- Median Sold Price: $425,000
- Sellers Received: 97.0% of asking price
Over the past 4 months, Pelican Preserve had 72 closings against 51 currently active listings, working out to 2.8 months of supply. That is a strong sales pace across this 55-plus community’s range of home types. The community-wide closed median of $425,000 reflects where the highest-volume sub-communities cluster. Prato had 11 closings at a $445,000 median, Materita 11 at $390,000, Casella 9 at $480,000, and Carena 8 at $625,000. The active pool, by contrast, is concentrated in lower-priced sub-communities. Palazzo (10 listings, $260K median ask) and Siena (6 listings, $248K median ask) account for much of the available supply. The 97.0% sold-to-list ratio across 72 closings indicates consistent pricing discipline. Buyers focused on $400K to $500K coach homes face the tightest competition. Lower-priced condo selection is more open.
Search Pelican Preserve homes for sale
Timber Creek
- Active Listings: 29
- Sold (Last 120 Days): 28
- Homes Pending: 10
- Pending-to-Active Ratio: 34.5%
- Previously Listed Share of Active: 27.6%
- Months of Inventory: 4.1
- Median Sold Price: $583,500
- Sellers Received: 97.4% of asking price
Timber Creek’s 28 closings over the past 4 months cleared at a 97.4% sold-to-list ratio and a 29-day median time to sell. The 29 currently active listings show a $479,500 median ask, below the $583,500 closed median. Available inventory has fewer of the larger single-family homes that drove recent closings. A 34.5% pending-to-active ratio confirms continued buyer engagement, with 10 contracts pending against 29 active. A 27.6% relist share indicates that just over a quarter of current active listings previously failed to sell within the past twelve months. Buyers ready to act on the larger home product should expect to compete. The smaller-square-footage active inventory offers more selection.
Search Timber Creek homes for sale
Lexington Country Club
- Active Listings: 34
- Sold (Last 120 Days): 75
- Homes Pending: 14
- Pending-to-Active Ratio: 41.2%
- Previously Listed Share of Active: 23.5%
- Months of Inventory: 1.8
- Median Sold Price: $275,000
- Sellers Received: 96.2% of asking price
Over the past 4 months, Lexington had 75 closings against only 34 currently active listings, working out to 1.8 months of supply. The community-wide closed median of $275,000 reflects the high-volume condo and villa neighborhoods. Waterford produced 19 closings at $259,900, Southmont Cove 16 at $233,000, Wedgewood 14 at $352,500, and Sommerset Villas 10 at $277,500. Beyond those, 10 single-family homes in the Golf Village neighborhoods cleared at a $725,000 median. The current active pool has 6 single-family at a $684,900 median ask alongside 28 condos and villas. Sellers and buyers in the Golf Village single-family neighborhoods should work from recent comparable sales in their own sub-area. The community-wide median reflects the much higher volume of condo and villa transactions.
Search Lexington Country Club homes for sale
WildBlue
- Active Listings: 29
- Sold (Last 120 Days): 30
- Homes Pending: 10
- Pending-to-Active Ratio: 34.5%
- Previously Listed Share of Active: 17.2%
- Months of Inventory: 3.9
- Median Sold Price: $1,425,000
- Sellers Received: 96.9% of asking price
Sellers in both neighborhoods, WildBlue and Vista WildBlue, are pricing close to recent closings. Vista WildBlue’s currently active listings show a $999,999 median ask against 11 closings over the past 4 months at a $1,199,000 median. Those active listings have been on the market just 22 days. These are recent listings entering at competitive prices below recent closing levels. WildBlue proper has 16 currently active listings at $1,847,000 against 19 closings at $1,800,000, a difference of just $47,000. A 17.2% relist share means most active listings have not previously failed to sell. The 34.5% pending-to-active ratio shows continued buyer demand. Buyers in either neighborhood can take current asking prices at face value. The narrow gap between active and closed medians limits negotiating room.
Search WildBlue homes for sale
Frequently Asked Questions
Fort Myers has the tightest active-vs-sold PPSF spread in the region at 5.1%, with asking prices closely aligned to recent sales. Active inventory is down 24.7% year over year and months of supply sits at 7.0. Well-priced homes find buyers at a 54-day median; the 259 returning listings without a price reduction offer more negotiating room.
The April sold-to-list ratio came in at 95.9% (about 4.1% below the most recent list price). The median relisted home sold at $44,000 (11.3%) below its original ask after roughly 8.3 months of combined market exposure. Offer strategy should reference recent neighborhood sales rather than the active asking range.
The median sale price fell 11.0% year over year, but PPSF fell only 5.5%. Most of the decline reflects a closing mix tilted toward lower-priced, smaller-square-footage homes. Per-square-foot values held up better than the headline number suggests.
First-attempt listings priced right and presented well sold in a median of 54 days. Relisted homes that eventually sold took 249 days combined across all attempts. The 4.6x difference is the cost of pricing meaningfully above where similar homes are clearing.
Fort Myers has the tightest active-vs-sold PPSF spread (5.1% versus 14.3% in Cape Coral and 14.0% in Bonita Springs). The trade-off is the highest Re-list Rate at 28.1%, reflecting accumulated returning sellers from prior listing attempts. Closings are growing again at 8.0% year over year.
Track the Fort Myers Market in Real Time
Create a free account to save searches and receive alerts on new listings, price reductions, and status changes for the homes you’re watching.
Final Thoughts
April closed with Fort Myers showing the cleanest pricing alignment in the region. The active-vs-sold PPSF spread of 5.1% is the tightest among the five cities, and the Re-list Rate at 28.1% points to a meaningful pool of returning sellers who have already accepted at least some price adjustment.
What This Means for Buyers and Sellers
For buyers, that pool is the most direct path to negotiating room. For sellers, the 54-day first-attempt median is the timing benchmark. Pricing within 5% of recent comparable sales on the same street is what brings buyers in.
The Worthington team works with buyers and sellers across Fort Myers neighborhoods every week. That includes Lexington Country Club, Pelican Preserve, WildBlue, the Daniels Parkway Corridor, and the broader Fort Myers area. Reading the data alone is one thing; using it to price a specific home or write a specific offer is what we do alongside our clients.
Schedule a 15-minute conversation to discuss your situation →
Most homeowners feel overwhelmed when it’s time to move. At Worthington Realty, we provide personalized guidance and clear communication so that you feel heard, valued, and confident in your decisions.
All data referenced in Worthington’s market reports draws from the Florida Gulf Coast MLS (FGCMLS via Stellar MLS) unless otherwise noted.
May 2026 Southwest Florida Housing Market Report Series
- Southwest Florida Housing Market Update
- Cape Coral Housing Market Update
- Estero Real Estate Market Update
- Bonita Springs Housing Market Update
- Naples Housing Market Update
Worthington MLS Search by City
Fort Myers | Cape Coral | Estero | Bonita Springs | Naples
For a full explanation of the indicators used in this report, see how Worthington Realty analyzes the Southwest Florida housing market.