
Median days on market fell from 62 to 55 as the relist dollar gap reached $84,000, the widest in Southwest Florida
The Bonita Springs housing market posted the largest year-over-year drop in median days on market in Southwest Florida in April. The figure fell from 62 days a year ago to 55. Months of supply compressed 41.0%, the second-steepest in the region after Estero. The Relist Cost Analysis revealed the widest dollar gap in the region: relisted homes that eventually sold closed at $84,000 (12.6%) below their original asking price. Price-range analysis shows genuine pricing misalignment at both ends of the market. Active asking prices per square foot (PPSF) run 16.0% above recent sold prices in homes under $400K. The active-vs-sold PPSF spread reaches 23.5% in the $1.5M-plus ranges. For regional context across the same data window, see the Southwest Florida housing market update.
Data reflects MLS records as of May 1, 2026. MLS figures may update as late transactions are recorded.
Key Takeaways
- Median days on market fell from 62 to 55, the largest year-over-year improvement in the region.
- Active inventory fell to 1,067, down 26.7% year over year, with months of supply dropping 41.0% from 11.7 to 6.9.
- The relist dollar gap is $84,000, the widest in Southwest Florida, with relisted homes selling at 12.6% below their original ask.
- Active asking PPSF runs widest above recent sold PPSF at both ends of the price range: 16.0% under $400K, 8.7% from $400K to $750K, 23.5% from $1.5M to $3M, and 23.5% above $3M.
- Competitive Months of Supply is 2.4 against an overall 5.1 (using consistent 3-month closing pace), with first-attempt listings closing in a 56-day median versus 258 days combined for relisted homes that eventually sold.
Regional Snapshot at a Glance
The table below summarizes the headline market metrics for each of the five Southwest Florida cities Worthington tracks, with Bonita Springs’s row highlighted. The detailed analysis that follows works through Bonita Springs’s metrics in turn.
| City | Median Sold Price | Price/SF | Active Listings | Months of Supply | Sold-to-List | Closed Sales YoY |
|---|---|---|---|---|---|---|
| Fort Myers | $325,000 | $206 | 3,221 | 7.0 | 95.9% | +8.0% |
| Cape Coral | $368,950 | $216 | 2,951 | 5.9 | 97.2% | +7.5% |
| Estero | $532,500 | $263 | 641 | 5.1 | 96.3% | +20.8% |
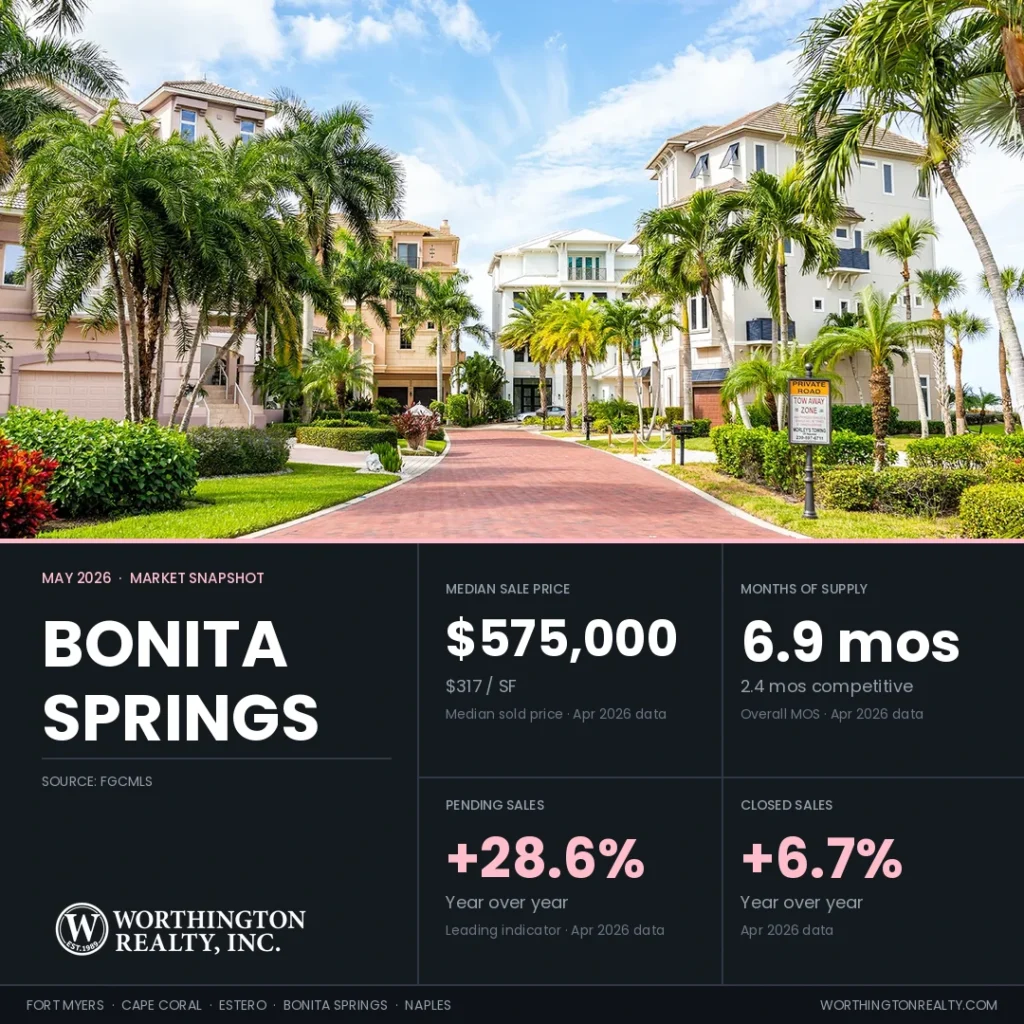
| Bonita Springs | $575,000 | $317 | 1,067 | 6.9 | 95.9% | +6.7% |
| Naples | $658,000 | $354 | 5,642 | 7.7 | 95.4% | +11.8% |
Source: FGCMLS via Stellar MLS. Single-month data unless otherwise noted. Sold-to-list uses most recent list price at time of contract.
Demand Acceleration Met a Steeply Compressing Supply Base
Closed sales tell us what buyers decided weeks ago, while pending sales tell us what they are deciding right now.
Bonita Springs recorded 223 closed sales in April, up 6.7% from April 2025, the tenth consecutive month of year-over-year growth. Pending sales totaled 189 new contracts in April, up 28.6% from a year ago, accelerating from +14.8% in March. The April Pending-to-Active Ratio of 17.7% (about one new contract per six active listings) sits just below the 17.9% regional average. The trailing three-month pending-to-closed ratio holds above 1.0, meaning more contracts are being signed than closing each month.
New listings totaled 206 in April, down 21.7% from 263 a year ago, the steepest decline in the region. The headline figure overstates the drop in genuinely fresh supply, though. We match new listings against the trailing 12 months of expired and withdrawn listings at the same address. Some of those April 206 are homes returning to market under new MLS numbers after a previous failed attempt. That share is consistent with the city’s 26.7% Re-list Rate on current active listings.
Inventory Drained 26.7% Year Over Year as Buyers Toured 50% More Homes Per Purchase
April ended with an active inventory of 1,067 homes, down 26.7% from 1,456 a year ago. There are 865 Bonita Springs listings that expired, were terminated, or were withdrawn from the market over the past 12 months. We refer to this as Shadow Inventory. These sellers may decide to return to the market with a new agent or at a new price point. While not a precise count, Shadow Inventory is a variable to consider against the available supply of homes for sale. The Bonita Springs count appears roughly stable from last month.
Showings per listing reached 3.1 in April, up 19.2% from 2.6 a year ago. The median home now receives 9 showings before going under contract, up from 6 a year ago. Buyers are touring more homes per purchase than they were last spring. That is consistent with a market where inventory has tightened but buyers are taking their time before committing.
The 30-year fixed-rate mortgage averaged 6.30% as of April 30, 2026, per Freddie Mac. That is down from 6.46% a month earlier and 6.76% a year earlier. At April’s $575,000 median sale price and 6.30%, a 20%-down conventional loan produces about $2,847 in monthly principal and interest. Property taxes, insurance, and HOA dues are additional.
Median Price Held Closer to Stable Than PPSF Suggests
Price per square foot (PPSF) tells you what buyers are paying per square foot of living space. PPSF is a cleaner read on home value than the median price. The median sale price moves around when the mix of homes closing in a given month changes.
Bonita Springs’ three-month rolling median sale price is $575,000, up 1.8% from $565,000 a year ago and up 0.9% from $570,000 in March 2026. April’s single-month figure was also $575,000, down 2.5% year over year and up 2.9% from $559,000 in March. The single-month figure reflects the specific mix of homes that closed in a city that averages 225 closings per month.
Bonita Springs’ three-month rolling PPSF is $310, down 5.8% from $329 a year ago and essentially flat against $309 in March. April’s single-month PPSF was $317. PPSF has bounced in a $293 to $329 range across the past 12 months. The most recent six months have run in a tighter $298 to $322 band.
Dollar Volume, Sold-to-List Ratio, and Price Reductions
Dollar volume reached $194 million, up 10.5% year over year. Closings rose 6.7% and dollar volume rose 10.5%, meaning the average sale price rose modestly versus April 2025. The slight rise in per-transaction value reflects a few more higher-priced homes in this month’s mix rather than per-square-foot value gains.
The April sold-to-list ratio reached 95.9%, up from 95.2% a year ago. Sellers received about 95.9% of their most recent asking price at the closing table, meaning buyers negotiated roughly 4.1% off list. The gap between original asking price and final sale price is substantially wider on relisted homes (see the Relist Cost Analysis below).
Price reductions have been recorded on roughly 40% to 45% of currently listed Bonita Springs homes, similar to last month. When those reductions still don’t generate offers, listings often expire and return later as relists. That’s the path that produces the region’s widest dollar gap.
The Relist Cost Analysis Shows the Region’s Widest Dollar Gap at $84,000
The Re-list Rate measures what share of currently listed homes have already failed to sell at least once in the past 12 months. It tells us how sellers as a group are responding to current market conditions.
Of the 1,055 Bonita Springs active listings in the address-matched analysis set, 282 (26.7%) have a prior listing in the trailing 12 months at the same address. Of those 282 returning listings, 218 came back with a price reduction of 3% or more from their previous attempt. Those are eligible for Competitive Inventory if they are also under 90 days into the current attempt. The remaining 64 returned at the same price or with a reduction under 3%, so they do not count as competitive supply.
Relisted Homes Sold $84,000 Below Original Ask After 4.6× the Market Time
The Relist Cost Analysis follows the homes that did eventually sell after one or more failed attempts. Across the past 4 months, sellers in this group originally asked a median of $669,000 and ultimately sold at a median of $585,000. That is an $84,000 gap (12.6% off the original asking price). Both the dollar gap and the percentage are the widest in the region. Combined across all listing attempts, these homes spent a median of 258 days on the market before closing. First-attempt sales cleared in 56 days. The relist process takes about 4.6 times longer to find a buyer than pricing correctly the first time.
Bonita Springs has the widest dollar gap in the region for two reasons. First, the city’s absolute price points are higher than Fort Myers or Cape Coral, so a similar percentage gap converts to more dollars. Second, the city has genuine overpricing in specific price ranges (documented below). The 64 returning listings without a price reduction concentrate in higher-priced single-family homes. Some of those sellers have been slowest to adjust to where comparable homes are actually clearing. Buyers above $1.5M will find the most negotiating room on listings that returned without a price reduction.
Competitive Inventory Reduces 5.1 Months of Supply to 2.4
Competitive Inventory strips stale listings and returning listings priced the same as before from the active count. The result reflects the supply that’s actively competing for buyers right now.
Three-part breakdown for Bonita Springs:
- Overall months of supply: 5.1 (using a trailing 3-month closing pace of 208 sales/month; the InfoSparks-published figure of 6.9 cited elsewhere uses a 12-month rolling pace)
- Stale-stripped months of supply: 4.2 (after removing 172 listings at 180-plus days on market without a meaningful reduction)
- Competitive Months of Supply: 2.4 (after additionally removing stubborn relists and listings 90 to 179 days old; resulting count of 490 listings under 90 days that are first-attempt or meaningful relists)
Bonita’s Overpricing Sits at Both Ends of the Spectrum
Bonita Springs’ active asking PPSF runs 14.0% above the recent sold PPSF on a blended basis. This compares the median PPSF of homes currently for sale to the median PPSF of homes that closed over the past 4 months. The two figures look at different time frames. Active asks are a snapshot of what sellers want right now, while sold PPSF reflects what buyers paid over the last 4 months. The spread shows the general direction of pricing, not whether any specific seller is asking too much.
Median active asking PPSF is $355, against $312 median sold PPSF over the past 4 months. Cape Coral’s wide blended figure mostly reflects a different mix of home types in the active and sold pools. Bonita Springs is different. The data shows genuine overpricing at both ends of the price spectrum.
Under $400K, the spread is 16.0%. The $400K to $750K range comes in at 8.7%, and $750K to $1.5M at 12.8%. From $1.5M to $3M, the spread reaches 23.5%, with above $3M at the same level.
Bonita is the only city in the region where the spread exceeds 20% in any price range. The $400K to $750K range is the cleanest segment for both buyers and sellers, with asking and sold prices closely aligned.
Worthington Realty Market Lens
The metrics below come from address-level analysis across all five cities. Bonita Springs’s row is highlighted. These metrics surface conditions that standard market reports do not capture. They show how many active listings have already failed to sell once before. They also show how long relisted homes ultimately take to clear and where active asking prices sit relative to recent sold prices.
| City | Competitive Months of Supply | Re-list Rate | Ask-Bid Gap (PPSF%) | Pending-to-Active Ratio | First-Attempt Median DOM | Relist Combined Median DOM |
|---|---|---|---|---|---|---|
| Fort Myers | 2.7 | 28.1% | 5.1% | 18.5% | 54 | 249 |
| Cape Coral | 2.7 | 24.6% | 14.3% | 21.1% | 51 | 246 |
| Estero | 2.0 | 23.0% | 5.7% | 25.4% | 59 | 258 |
| Bonita Springs | 2.4 | 26.7% | 14.0% | 17.7% | 56 | 258 |
| Naples | 2.7 | 26.1% | 13.0% | 17.3% | 56 | 252 |
Source: FGCMLS via Stellar MLS. Single-month data for Pending-to-Active Ratio. Re-list Rate, Ask-Bid Gap, DOM split, and Competitive Months of Supply use a 4-month sold population against the current active snapshot.
Closed Comparables Are Setting the Pace in Bonita Springs Featured Communities
The six Worthington-tracked Bonita Springs communities span the city’s product range from Marbella’s $425,000 coach homes at Spanish Wells to Pelican Landing’s $2,450,000 Colony estate closings. The community-level data this cycle shows just how differently the high-end gated communities and the 55-plus communities are selling. Pending-to-active ratios run from 18.6% at Spanish Wells to 70.0% at VillageWalk.
Spanish Wells Golf and Country Club
- Active Listings: 43
- Sold (Last 120 Days): 31
- Homes Pending: 8
- Pending-to-Active Ratio: 18.6%
- Previously Listed Share of Active: 18.6%
- Months of Inventory: 5.5
- Median Sold Price: $640,000
- Sellers Received: 96.8% of asking price
Spanish Wells covers three product types that sell at very different prices, and treating it as one community would mislead buyers in any of them. Over the past 4 months, the Spanish Wells single-family core delivered 14 closings at a $767,500 median in 41 days. There are 15 currently active listings asking a $875,000 median. Marbella’s coach homes and villas had 11 closings at a $425,000 median over just 22 days, alongside 13 currently active Marbella listings at a $395,000 median ask. Cordova produced 3 closings at a $913,000 median, with 3 currently active listings at a $1,275,000 median ask. The community-wide 18.6% relist share means most active listings have not previously failed to sell. Buyers should base their pricing analysis on recent sales within their target sub-community, since the community-wide $640,000 median masks all three product types.
Search Spanish Wells homes for sale
Bonita National Golf and Country Club
- Active Listings: 44
- Sold (Last 120 Days): 41
- Homes Pending: 15
- Pending-to-Active Ratio: 34.1%
- Previously Listed Share of Active: 18.2%
- Months of Inventory: 4.3
- Median Sold Price: $750,000
- Sellers Received: 96.6% of asking price
Bonita National’s 4.3 months of supply and 34.1% pending-to-active ratio describe a market with steady demand across a wide product range. Recent closings totaled 41 over the past 4 months at a $750,000 median across condos, coach homes, and single-family product. The 44 currently active listings show a $677,000 median ask and have been on the market a median of 86 days. Active asking sits below the closed median because the active pool is weighted toward smaller condo and coach-home product. Within each product type, asking and sold prices are aligned. An 18.2% relist share means most active listings have not previously failed to sell. Golf membership type is the essential due-diligence item before any offer here. Full bundled golf and social-only memberships coexist in this community. The cost difference between them is significant. That distinction does not appear in the MLS price field.
Search Bonita National homes for sale
Pelican Landing
- Active Listings: 96
- Sold (Last 120 Days): 100
- Homes Pending: 22
- Pending-to-Active Ratio: 22.9%
- Previously Listed Share of Active: 27.1%
- Months of Inventory: 3.8
- Median Sold Price: $770,000
- Sellers Received: 96.1% of asking price
The Colony sub-communities at Pelican Landing sell at very different prices than the rest of the community, and the community-wide figures hide that. The Colony includes Infinity, Cielo, La Scala, and Castella. It accounts for 53 of 96 currently active listings at a $1,299,900 median ask. Over the past 4 months, Colony closings totaled 32 of 100 at a $2,450,000 median in 49 days. Non-Colony Pelican Landing has 43 currently active listings at a $589,000 median ask and 68 closings at a $605,000 median in 36 days. Infinity at the Colony alone delivered 14 closings at a $3,450,000 median in just 18 days. Buyers should identify which side of Pelican Landing they are shopping before applying any community-wide metric. The Colony and non-Colony sides are not competing for the same buyers.
Search Pelican Landing homes for sale
Seasons at Bonita
- Active Listings: 15
- Sold (Last 120 Days): 13
- Homes Pending: 6
- Pending-to-Active Ratio: 40.0%
- Previously Listed Share of Active: 53.3%
- Months of Inventory: 4.6
- Median Sold Price: $630,000
- Sellers Received: 96.5% of asking price
A 53.3% relist share is the headline at Seasons at Bonita. Of the 15 currently active listings, 8 have previously failed to sell within the past twelve months. Despite that, the 13 closings over the past 4 months settled at a $630,000 median in just 24 days. The current active median ask of $629,000 is closely aligned with the closed median, indicating that returning sellers have generally adjusted to where the market is clearing. With only 13 closings, a single sale can move the numbers, and buyers and sellers should rely on recent sales of comparable floor plans. Sellers entering at the recent sale range are converting quickly; those holding above $700,000 should expect extended marketing.
Search Seasons at Bonita homes for sale
Valencia Bonita
- Active Listings: 20
- Sold (Last 120 Days): 25
- Homes Pending: 10
- Pending-to-Active Ratio: 50.0%
- Previously Listed Share of Active: 40.0%
- Months of Inventory: 3.2
- Median Sold Price: $815,000
- Sellers Received: 95.5% of asking price
Valencia Bonita’s 50.0% pending-to-active ratio reflects sustained demand in this 55-plus community, with 10 contracts pending against 20 currently active listings. Recent closings totaled 25 over the past 4 months at an $815,000 median in 65 days. The 20 currently active listings show a $689,900 median ask and have only been on the market 56 days. Active inventory runs lighter on the larger estate product that drove the closed median upward, weighted instead toward 2-bedroom and 2+den villas. A 40.0% relist share is high for a community moving inventory this quickly, with relist listings priced higher on average than first-attempt listings. Standard villa sellers who price within the recent sale range are seeing real demand.
Search Valencia Bonita homes for sale
VillageWalk of Bonita Springs
- Active Listings: 20
- Sold (Last 120 Days): 29
- Homes Pending: 14
- Pending-to-Active Ratio: 70.0%
- Previously Listed Share of Active: 10.0%
- Months of Inventory: 2.8
- Median Sold Price: $480,000
- Sellers Received: 96.9% of asking price
VillageWalk’s metrics this cycle reflect clean demand. The 70.0% pending-to-active ratio runs 14 contracts on 20 currently active listings. A 10.0% relist share and a 32-day median time to sell across 29 closings over the past 4 months tell a clear story. Most active listings are first-attempt and buyers are responding. The current active median ask of $494,000 and closed median of $480,000 are tightly aligned. The 96.9% sold-to-list ratio shows buyers and sellers settling close to asking. Sellers entering with a price tied to recent comps are converting in roughly a month. The volume of pending contracts means homes are leaving the market here faster than new ones are listing.
Search VillageWalk of Bonita Springs homes for sale
Frequently Asked Questions
Bonita has the largest year-over-year improvement in time to sell (62 to 55 days) and the second-steepest drop in months of supply (-41.0%). The trade-off is the region’s widest relist dollar gap at $84,000. Active asking PPSF runs 8.7% above recent solds from $400K to $750K, 16.0% under $400K, and 23.5% above $1.5M.
The April sold-to-list ratio came in at 95.9%, meaning the median home sold for about 4.1% below its most recent listed price. The median relisted home sold at $84,000 (12.6%) below its original ask after 8.6 months of combined market exposure. Asking prices from $400K to $750K are roughly aligned with recent sold prices. Asking prices under $400K and above $1.5M run further above recent solds, leaving more room to negotiate.
The wider spread reflects genuine overpricing at both ends: 16.0% under $400K and 23.5% above $1.5M. The $400K to $750K range is the cleanest segment at 8.7%.
First-attempt listings priced right and presented well sold in a median of 56 days. Relisted homes that eventually sold took 258 days combined across all attempts. The 4.6x difference is the cost of pricing above recent comps.
Bonita is the only city in the region where active asking PPSF runs more than 13% above recent sold PPSF in multiple price ranges. It also has the widest relist dollar gap in the region at $84,000.
Track the Bonita Springs Market in Real Time
Create a free account to save searches and receive alerts on new listings, price reductions, and status changes for the homes you’re watching.
Final Thoughts
April closed with Bonita Springs holding the largest year-over-year improvement in median time to sell. Pending sales accelerated meaningfully, and the data revealed genuine overpricing at both ends of the price spectrum.
What This Means for Buyers and Sellers
For buyers, the read is clear. Homes from $400K to $750K are closely aligned with recent sales. Homes under $400K and above $1.5M both offer real negotiating room. For sellers, the lesson is straightforward: homes priced within the recent comparable sale range are finding buyers in 56 days. Homes reaching meaningfully above that range are spending roughly 4.6 times longer on the market before eventually selling at $84,000 below their original asking price.
The Worthington team works with buyers and sellers across Bonita Springs neighborhoods every week. That includes Spanish Wells Golf and Country Club, Pelican Landing, Valencia Bonita, and the broader Bonita Springs area. Reading the data is one part of the work. Using it to value a specific home or write a specific offer is what we do alongside our clients.
Schedule a 15-minute conversation to discuss your situation →
Most homeowners feel overwhelmed when it’s time to move. At Worthington Realty, we provide personalized guidance and clear communication so that you feel heard, valued, and confident in your decisions.
All data referenced in Worthington’s market reports draws from the Florida Gulf Coast MLS (FGCMLS via Stellar MLS) unless otherwise noted.
May 2026 Southwest Florida Housing Market Report Series
- Southwest Florida Housing Market Update
- Fort Myers Housing Market Update
- Cape Coral Housing Market Update
- Estero Housing Market Update
- Naples Housing Market Update
Worthington MLS Search by City
Fort Myers | Cape Coral | Estero | Bonita Springs | Naples
For a full explanation of the indicators used in this report, see how Worthington Realty analyzes the Southwest Florida housing market.