

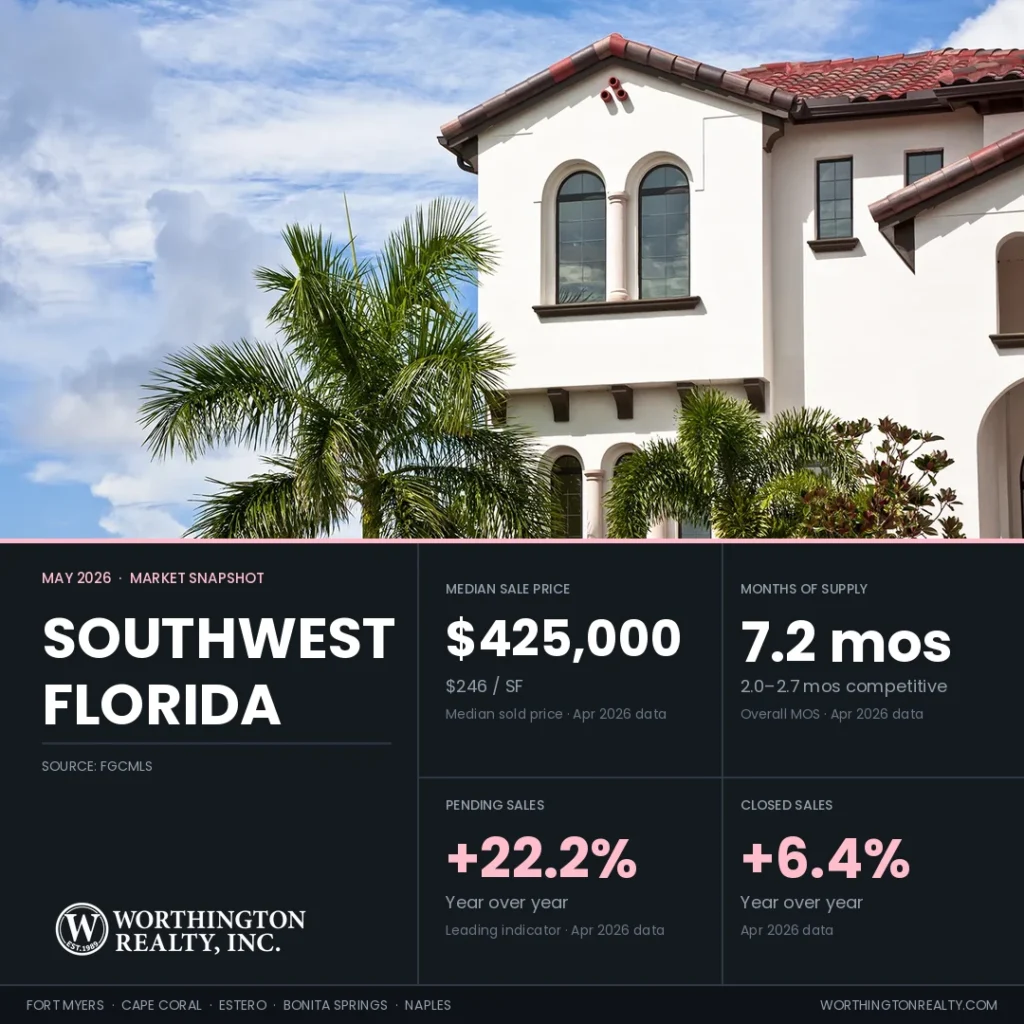
Pending sales rose 22.2% in April with closings positive in every Southwest Florida city as showings climbed region-wide
The Southwest Florida housing market saw supply tighten further in April. Active inventory dropped 21.7% year over year, and overall months of supply fell from 10.7 to 7.2. Showings per listing rose to 3.4 from 3.0 a year ago, with every city showing year-over-year gains. More buyers are showing up against meaningfully fewer homes for sale. Worthington’s full city-level analysis is linked below for Fort Myers, Cape Coral, Estero, Bonita Springs, and Naples, all drawing from the same Florida Gulf Coast MLS dataset.
Data reflects MLS records as of May 1, 2026. MLS figures may update as late transactions are recorded.
Key Takeaways
- Pending sales rose 22.2% year over year across Southwest Florida, with Estero leading at +56.7%, Naples at +36.0%, and Bonita Springs at +28.6%.
- All five markets posted year-over-year closing growth in April, with regional volume up 6.4%. Cape Coral was the most notable improvement, moving from essentially flat in March (-0.7%) to +7.5% in April. Estero (+20.8%) and Naples (+11.8%) led the region on growth rate.
- Months of supply compressed sharply, with Estero at 5.1 (from 9.3), Bonita Springs at 6.9 (from 11.7), and the regional figure at 7.2 (from 10.7).
- Competitive Months of Supply ranges from 2.0 in Estero to 2.7 in Fort Myers, Cape Coral, and Naples, with the regional Relist Cost Analysis showing a $43,750 to $84,000 dollar gap between original ask and final sale for relisted homes.
- Showings per listing rose in every city, led by Naples (3.5 vs. 2.7) and Cape Coral (4.9 vs. 3.9). Sold-to-list ratios held within half a percentage point of a year ago in every city.
Regional Snapshot at a Glance
The table below summarizes the headline market metrics for each of the five Southwest Florida cities Worthington tracks. The detailed analysis that follows works through each metric in turn, with city-by-city context.
| City | Median Sold Price | Price/SF | Active Listings | Months of Supply | Sold-to-List | Closed Sales YoY |
|---|---|---|---|---|---|---|
| Fort Myers | $325,000 | $206 | 3,221 | 7.0 | 95.9% | +8.0% |
| Cape Coral | $368,950 | $216 | 2,951 | 5.9 | 97.2% | +7.5% |
| Estero | $532,500 | $263 | 641 | 5.1 | 96.3% | +20.8% |
| Bonita Springs | $575,000 | $317 | 1,067 | 6.9 | 95.9% | +6.7% |
| Naples | $658,000 | $354 | 5,642 | 7.7 | 95.4% | +11.8% |
Source: FGCMLS via Stellar MLS. Single-month data unless otherwise noted. Sold-to-list uses most recent list price at time of contract.
Closings Held Positive in Every Market
Closed sales tell us what buyers decided weeks ago. Pending sales tell us what they are deciding right now. In April, both readings ran positive across every Southwest Florida market.
Regional closed sales reached 3,416 in April, up 6.4% from April 2025. Fort Myers recorded 595 closings (+8.0% YoY), Cape Coral 589 (+7.5%), Estero 174 (+20.8%), Bonita Springs 223 (+6.7%), and Naples 966 (+11.8%). All five markets posted year-over-year closing growth in April. Cape Coral showed the largest improvement from March, moving from essentially flat (-0.7%) to +7.5% growth.
Regional dollar volume reached $2.53 billion, up 2.8% year over year. Dollar volume grew slower than the count of homes sold because price-per-square-foot figures slipped slightly across most cities.
Pending sales counted 3,496 new contracts across the region in April, up 22.2% from April 2025. Estero’s pending count rose 56.7% year over year, Naples 36.0%, and Bonita Springs 28.6%. The regional April Pending-to-Active Ratio sits at 17.9%, with city-level figures running from 17.3% in Naples to 25.4% in Estero. More contracts are being signed than are closing each month across all five cities. No city is showing the kind of drop-off between contracts and closings that would point to broader stress.
Showings per listing reached 3.4 region-wide, up from 3.0 a year ago. Naples at 3.5 showed the largest year-over-year jump (+29.6%) in the region. Cape Coral has the highest absolute level at 4.9 showings per listing, the highest of any city in the dataset.
30-Year Mortgage Rates Dropped to 6.30% in April
The 30-year fixed-rate mortgage averaged 6.30% as of April 30, 2026, per Freddie Mac’s Primary Mortgage Market Survey. That is down from 6.46% a month earlier and 6.76% a year earlier. The 16-basis-point decline over the past month coincided with the pending and showing increases observed in the data.
At April’s median sale prices and 6.30%, a 20%-down conventional loan produces monthly principal and interest of about $1,609 in Fort Myers and $1,827 in Cape Coral. It produces about $2,637 in Estero, $2,847 in Bonita Springs, and $3,258 in Naples. Property taxes, insurance, and HOA dues are additional. Rate movement directly affects financed buyers. The cash share runs higher in the higher-priced segments of Naples and Bonita Springs, where rate moves matter less.
Active Listings Fell Sharply While New Listings Slowed
The standard active listings count combines fresh listings, returning relists, and stale inventory equally. The new listings count includes both first-attempt entries and homes returning to market under new MLS numbers. When relist activity is high, the new-listings count includes a meaningful share of homes returning to market, so the genuinely-fresh portion is smaller than the headline figure suggests.
Regional active inventory dropped to 19,557 homes in April, down 21.7% year over year. Every city posted a meaningful decline: Fort Myers -24.7%, Cape Coral -27.1%, Estero -29.9%, Bonita Springs -26.7%, Naples -22.3%. The five cities tracked in this series account for 13,522 of those 19,557 active listings (69.1%). The remaining homes sit in surrounding markets that fall within the regional MLS but outside Worthington’s primary five-city coverage area.
New listings reached 4,357 region-wide in April, down 12.4% year over year. The decline is steepest in Bonita Springs (-21.7%) and Estero (-19.8%), and lightest in Fort Myers (-8.0%). Address-level matching against trailing 12-month expired and withdrawn data tells a fuller story. The new-listing count includes some homes returning to market under new MLS numbers across all five cities, consistent with city Re-list Rates running between 23.0% and 28.1%. The genuinely fresh portion of new listings is therefore lower than the headline figure suggests.
Months of Supply Compressed by 33% Region-Wide
Months of supply measures how many months it would take to sell through current inventory at the current pace of closings, assuming no new homes hit the market. Six months is the traditional benchmark for a balanced market, though the season and price range matter as much as the headline number in Southwest Florida.
Regional months of supply reached 7.2 in April, down from 10.7 a year ago. That 32.7% compression marks the lowest reading in 19 months. The figure has eased from a March 2025 peak of 10.9. It now sits below the 7.4 to 8.6 range that held through the back half of 2024 and most of 2025. It remains above the post-COVID-era trough of 3.1 reached in November 2022. The reading also sits modestly above the pre-COVID Southwest Florida norm of roughly 5.5 to 6.5 months. The current reading reflects normalization toward balance rather than a swing into seller’s market.
City-level figures: Fort Myers 7.0 (from 10.5), Cape Coral 5.9 (from 9.0), Estero 5.1 (from 9.3), Bonita Springs 6.9 (from 11.7), Naples 7.7 (from 12.0). Estero’s 45.2% drop is the steepest year-over-year compression in the region.
Every City Holds Competitive Supply at 2.7 Months or Less
Worthington’s analysis goes deeper. The standard months-of-supply figure counts every active listing equally. That means a home sitting at the same price for 14 months counts the same as a fresh, well-priced listing from last week. Worthington calculates Competitive Inventory by stripping two categories from the active count. The first is stale listings: homes 180 or more days on market without a meaningful price reduction. The second is returning listings without a price reduction: homes returning to market at the same price or with a reduction under 3% from their prior listing.
Competitive Months of Supply across the five cities ranges from 2.0 in Estero to 2.7 in Fort Myers, Cape Coral, and Naples. Bonita Springs sits at 2.4. The full three-part breakdown for each city appears in the city reports. The supply problem in Southwest Florida is genuinely concentrated at the higher end and in homes that have already failed to attract buyers at their current asking price.
The Relist Cost Analysis Shows a $44,000 to $84,000 Gap
The Relist Rate measures what percentage of current active listings have already failed to sell at least once in the past 12 months. It tells us how sellers as a group are responding to current conditions. Every time a home fails to sell and relists, its days on market clock resets to zero. A buyer browsing the active listings cannot see prior listing history without specifically asking.
Regional Relist Rate sits at 26.0% averaged across the five cities. Fort Myers leads at 28.1%, followed by Bonita Springs at 26.7%, Naples at 26.1%, Cape Coral at 24.6%, and Estero at 23.0%. About one in four active listings across the region is on a second or later attempt to find a buyer.
Relisted Homes Take 4 to 5 Times Longer to Sell
First-attempt median days on market for homes that sold in the past 4 months runs in a tight band of 51 to 59 days across all five cities. Fort Myers 54 days, Cape Coral 51, Estero 59, Bonita Springs 56, Naples 56. The combined median days on market for relisted homes that eventually sold runs 246 to 258 days. Estero and Bonita Springs both clock at 258, with Cape Coral at 246. Relisted homes that eventually sell take roughly four to five times longer to clear than homes priced correctly the first time.
Bonita Springs Sellers Lost $84,000 on Average After Relisting
The median Bonita Springs home that relisted and eventually sold closed for $84,000, or 12.6%, below its original asking price. That is the widest dollar gap in Southwest Florida this month. Naples follows at $81,500 (11.0% below), Cape Coral at $44,500 (9.8%), Estero at $49,950 (10.0%), and Fort Myers at $44,000 (11.3%). Across all five cities, why homes get relisted traces back to the same pattern. Sellers enter above where similar homes were closing, then accept a lower price after months of accumulated time on market. The dollar cost is highest in cities with higher absolute price points, where the same percentage gap converts to more dollars.
Median Price and PPSF Diverged Sharply in Naples This Month
Median sale price moves around when the mix of homes closing in a given month changes. More high-priced closings push it up, more lower-priced closings push it down, even when actual home values have not changed. Price per square foot (PPSF) tells you what buyers are paying per square foot of living space. PPSF is a cleaner read on home value than the median price.
Regional median sale price reached $425,000 in April, up 3.0% from $412,500 a year ago and up 6.2% from $400,000 in March 2026. PPSF region-wide was $246, down 1.6% year over year and up 2.5% from $240 in March. The median has been drifting up over the past five months, climbing from a $390,000 reading last fall back into the $400,000 to $425,000 range to start 2026.
The most pronounced single-month divergence between median and PPSF occurred in Naples. Naples median sale price rose to $658,000, up 9.7% year over year, while Naples PPSF was $354, up only 2.3%. The share of Naples closings priced over $1.5 million grew from 18.7% in March to 21.2% in April. Closings above $3M alone accounted for 8.0% of April closings versus 6.6% in March. The $69,500 jump in the median sale price came from a higher share of expensive homes closing in April than a typical month, while underlying value stayed essentially flat.
Smaller Markets Need a Three-Month Rolling Read
The opposite condition occurred in smaller cities. Estero’s single-month median sale price came in at $532,500 (down 3.6% YoY), while the three-month rolling median is $490,000 (down 6.7% YoY). The rolling figure averages out the volatility from low monthly closing volume in a city that closes around 175 homes per month. Bonita Springs faces the same volume condition with 223 April closings. Its three-month rolling median is $575,000, up 1.8% from $565,000 a year ago, while the single-month YoY change shows -2.5%. The rolling read points to modest stability over the past 12 months in Bonita Springs.
Regional dollar volume of closed sales reached $2.53 billion in April, up 2.8% year over year. Cape Coral grew 10.1%, Bonita Springs 10.5%, and Estero 28.0%. Naples dollar volume slipped 1.3% despite the +11.8% closed-sales count. The same shift in the mix of closings operates here in the opposite direction. More homes closed, but the composition was slightly less weighted toward higher-priced product than April 2025.
The Sold-to-List Ratio Held Steady While Asking Prices Stayed Above Recent Solds
The sold-to-list ratio compares what homes sold for to what they were asking at the time of contract. Worthington uses the most recent list price at time of contract for this calculation.
Regional sold-to-list ratio reached 96.2% in April, up only 0.2 percentage points from a year ago. Sellers received 95.4% to 97.2% of their most recent asking price across the region: Fort Myers 95.9%, Cape Coral 97.2%, Estero 96.3%, Bonita Springs 95.9%, Naples 95.4%. Buyers are negotiating roughly 4 to 5% off list, the same range as a year ago.
The active-vs-sold PPSF spread compares the median PPSF of homes currently for sale to the median PPSF of homes that have closed over the past 4 months. The two figures look at different time frames. Active asks are a snapshot of what sellers want right now, while sold PPSF reflects what buyers paid over the last 4 months. The spread shows the general direction of pricing, not whether any specific seller is asking too much. It varies by city far more than the sold-to-list ratio does. Fort Myers sits at 5.1%, Estero at 5.7%, Naples 13.0%, Bonita Springs 14.0%, and Cape Coral 14.3%. Fort Myers now has the tightest spread in the region, the first cycle in which it has held that position. Cape Coral and Bonita Springs are essentially tied at the wide end.
Inside Each City by Price Range
Each cell shows how far active asking PPSF runs above or below recent sold PPSF in that price range. A positive number means active sellers are asking above where comparable homes have been clearing. A negative number means active sellers are asking below recent sold comparables, which is unusual.
| City | Under $400K | $400K-$750K | $750K-$1.5M | $1.5M-$3M | Above $3M |
|---|---|---|---|---|---|
| Fort Myers | +6.4% | +1.9% | +4.6% | +4.6% | n/a |
| Cape Coral | +8.3% | +5.6% | +6.4% | ~0% | n/a |
| Estero | +8.3% | +2.5% | -3.3% | -1.4% | n/a |
| Bonita Springs | +16.0% | +8.7% | +12.8% | +23.5% | +23.5% |
| Naples | +8.0% | +3.3% | +9.0% | +5.2% | +16.1% |
Cape Coral’s wide blended figure mostly reflects a different mix of home types in the active and sold pools. Higher-priced waterfront listings are sitting against an inland-weighted closed pool. Naples’ wide blended figure is driven almost entirely by misalignment above $3M. Bonita Springs is the only city in the region with real overpricing across multiple price ranges. Estero is the only city with negative gaps, meaning sellers in some ranges are entering at prices below where comparable homes have actually been clearing.
Price Reductions Continued at the Same Pace
A meaningful price reduction is three percent or more from the original asking price. Anything under two percent is typically cosmetic, made to refresh search visibility rather than to genuinely meet the market.
Across the five cities, the share of active listings that have reduced their asking price at least once runs in the 35% to 45% range. When those reductions still don’t generate offers, listings often expire and return later as relists. That’s the path that produces the $44,000 to $84,000 dollar gap captured in the Relist Cost Analysis above.
Shadow Inventory Held Roughly Stable Across the Region
Across the five cities, 11,600 listings have expired, were terminated, or were withdrawn from the market over the past 12 months without returning to the market. We refer to this as Shadow Inventory, as these sellers may decide to return to the market with a new agent or at a new price point. While not a precise count, Shadow Inventory is a variable to consider against the available supply of homes for sale. The regional count appears roughly stable from last month.
Worthington Realty Market Lens
The metrics below come from address-level analysis of the active and recent sold pools across all five cities. These metrics surface conditions that standard market reports do not capture. They show how many active listings have already failed to sell once before. They also show how long relisted homes ultimately take to clear and where active asking prices sit relative to recent sold prices.
| City | Competitive Months of Supply | Re-list Rate | Ask-Bid Gap (PPSF%) | Pending-to-Active Ratio | First-Attempt Median DOM | Relist Combined Median DOM |
|---|---|---|---|---|---|---|
| Fort Myers | 2.7 | 28.1% | 5.1% | 18.5% | 54 | 249 |
| Cape Coral | 2.7 | 24.6% | 14.3% | 21.1% | 51 | 246 |
| Estero | 2.0 | 23.0% | 5.7% | 25.4% | 59 | 258 |
| Bonita Springs | 2.4 | 26.7% | 14.0% | 17.7% | 56 | 258 |
| Naples | 2.7 | 26.1% | 13.0% | 17.3% | 56 | 252 |
Source: FGCMLS via Stellar MLS. Single-month data for Pending-to-Active Ratio. Re-list Rate, Ask-Bid Gap, DOM split, and Competitive Months of Supply use a 4-month sold population against the current active snapshot.
City-Level Snapshots
Fort Myers

- Active Listings: 3,221
- Sold (Last 120 Days): 2,022
- Months of Supply (Overall / Competitive): 7.0 / 2.7
- Median Sold Price: $325,000
- Sellers Received: 95.9% of asking price
- Re-list Rate: 28.1%
- Pending-to-Active Ratio: 18.5%
Fort Myers is the city where the April-to-May transition shows the cleanest pricing alignment. The active-vs-sold PPSF spread sits at 5.1%, the tightest in the region this month. Closed sales rose 8.0% year over year, the eighth consecutive month of year-over-year growth, and the Pending-to-Active Ratio reached 18.5%. With the highest Re-list Rate in the region at 28.1%, Fort Myers has more accumulated returning sellers than any other city. Those who priced to current sales are converting at a 54-day median.
Read the full Fort Myers Housing Market Update | Search Fort Myers homes for sale
Cape Coral

- Active Listings: 2,951
- Sold (Last 120 Days): 2,014
- Months of Supply (Overall / Competitive): 5.9 / 2.7
- Median Sold Price: $368,950
- Sellers Received: 97.2% of asking price
- Re-list Rate: 24.6%
- Pending-to-Active Ratio: 21.1%
Cape Coral’s buyer activity stands out across the region. Showings per listing climbed to 4.9, the highest level of any city, up 25.6% year over year, and dollar volume rose 10.1%. The headline 14.3% active-vs-sold PPSF spread appears wide. Price-range analysis shows the spread is largely driven by mix between the active waterfront inventory and the broader resale closing pool. By price range, the spreads are 8.3% under $400K, 5.6% from $400K to $750K, and 6.4% from $750K to $1.5M. Buyers active in this city should expect competition on well-priced inland resale and substantially more selection on Gulf-access waterfront.
Read the full Cape Coral Housing Market Update | Search Cape Coral homes for sale
Estero

- Active Listings: 641
- Sold (Last 120 Days): 611
- Months of Supply (Overall / Competitive): 5.1 / 2.0
- Median Sold Price: $532,500 (3-mo rolling: $490,000)
- Sellers Received: 96.3% of asking price
- Re-list Rate: 23.0%
- Pending-to-Active Ratio: 25.4%
Three demand metrics for Estero ran ahead of every other city this month. Pending sales rose 56.7% year over year, dollar volume jumped 28.0%, and overall months of supply compressed 45.2%. Closings rose 20.8% year over year, the eighth consecutive month of year-over-year growth. The Pending-to-Active Ratio of 25.4% is the highest among the five cities, and Competitive Months of Supply reached 2.0, the lowest in the region. Estero remains the clearest case of seller pricing discipline meeting strong demand.
Read the full Estero Real Estate Market Update | Search Estero homes for sale
Bonita Springs

- Active Listings: 1,067
- Sold (Last 120 Days): 771
- Months of Supply (Overall / Competitive): 6.9 / 2.4
- Median Sold Price: $575,000
- Sellers Received: 95.9% of asking price
- Re-list Rate: 26.7%
- Pending-to-Active Ratio: 17.7%
Bonita Springs saw the largest year-over-year drop in median days on market in the region, with the figure falling from 62 days a year ago to 55 in April. Closings rose 6.7% year over year, the tenth consecutive month of year-over-year growth. Months of supply compressed 41.0%. The relist dollar gap of $84,000 (12.6% below original asking) is the widest in Southwest Florida. Active asking PPSF runs heaviest above recent sold PPSF under $400K (13.7%) and at the high end (18.8% from $1.5M to $3M and 19.0% above $3M). Bonita is the city where pricing alignment at both ends of the spectrum is most actionable for buyers and sellers.
Read the full Bonita Springs Housing Market Update | Search Bonita Springs homes for sale
Naples

- Active Listings: 5,642
- Sold (Last 120 Days): 3,315
- Months of Supply (Overall / Competitive): 7.7 / 2.7
- Median Sold Price: $658,000
- Sellers Received: 95.4% of asking price
- Re-list Rate: 26.1%
- Pending-to-Active Ratio: 17.3%
Naples closed $1.22 billion in dollar volume in April with closings up 11.8% year over year. Showings per listing rose 29.6%, the largest engagement gain in the region. The headline 9.7% jump in median sale price reflects a closing mix that tilted toward higher-priced homes this month. The share of closings priced over $1.5 million grew from 18.7% in March to 21.2% in April, while PPSF rose just 2.3% year over year. Closings rose 11.8% year over year, the eleventh consecutive month of year-over-year growth and the longest active streak in the region. Pending sales rose 36.0%. Buyers above $3M face the widest within-range active-vs-sold PPSF spread at 16.1%, while the $400K to $750K range sits at just 3.3%.
Read the full Naples Housing Market Update | Search Naples homes for sale
Frequently Asked Questions
Conditions moved further toward balance. Active inventory fell from 24,970 a year ago to 19,557, and overall months of supply dropped from 10.7 to 7.2. Competitive Inventory ranges from 2.0 to 2.7 months across the five cities, with Estero and Bonita Springs running tightest. Sold-to-list ratios held steady, so buyers still have negotiating room on most sales.
The median home sold for 95.4% (Naples) to 97.2% (Cape Coral) of its most recent list price at contract. Relisted homes that eventually sold closed at 10.0% to 12.6% below their original asking price.
Smaller markets like Estero and Bonita Springs are sensitive to the mix of homes closing in any given month. A handful of high-priced closings can swing the median without home values changing. Naples showed the same effect at scale: closings over $1.5 million grew from 18.7% to 21.2% between March and April.
Buyer activity rose meaningfully. Showings per listing climbed in every city, led by Cape Coral (4.9 vs. 3.9) and Naples (3.5 vs. 2.7). Yet sold-to-list ratios moved less than half a percentage point. The market got busier without getting more expensive.
A well-priced first-attempt home should find a buyer within roughly two months across all five cities, confirmed by the first-attempt median time on market of 51 to 59 days. Sellers testing a price meaningfully above recent comparables should expect four to five times longer.
Track the Southwest Florida Market in Real Time
Create a free account to save searches and receive alerts on new listings, price reductions, and status changes for the homes you’re watching across Fort Myers, Cape Coral, Estero, Bonita Springs, and Naples.
Final Thoughts
April delivered broad demand strength across Southwest Florida. Regional pending sales rose 22.2% year over year and regional closings rose 6.4%, with year-over-year growth in every market. Showings per listing climbed in all five cities, and supply continued to tighten. Within those broad strokes, each city is telling a different story, with pricing close to recent sales mattering more in some places than in others.
The Worthington team works with buyers and sellers across all five Southwest Florida cities every week. Reading the data alone is one thing; using it to make a decision about your specific home, neighborhood, and timeline is what we do alongside our clients.
Search homes across Southwest Florida →
Schedule a 15-minute conversation to discuss your situation →
Most homeowners feel overwhelmed when it’s time to move. At Worthington Realty, we provide personalized guidance and clear communication so that you feel heard, valued, and confident in your decisions.
All data referenced in Worthington’s market reports draws from the Florida Gulf Coast MLS (FGCMLS via Stellar MLS) unless otherwise noted.
May 2026 Southwest Florida Housing Market Report Series
- Fort Myers Housing Market Update
- Cape Coral Housing Market Update
- Estero Real Estate Market Update
- Bonita Springs Housing Market Update
- Naples Housing Market Update
Worthington MLS Search by City
Fort Myers | Cape Coral | Estero | Bonita Springs | Naples
For a full explanation of the indicators used in this report, see how Worthington Realty analyzes the Southwest Florida housing market.