

This is a past report. It covers Bonita Springs market data for June 2026. For current numbers, see our Bonita Springs housing market page.
Active inventory fell 29.3% year over year, while the luxury Ask-Bid Gap reached 40.2%, meaning the median luxury listing asked 40.2% more per square foot than recent luxury sales.
Bonita Springs entered summer with fewer homes for sale and the same number of closings as last June, 136 homes, ending an eleven-month growth streak with a flat result. Pending sales still rose 10.4%. The pressure is concentrated at the top of the market: the blended 18.6% Ask-Bid Gap widens sharply above $1.5 million, while lower price ranges remain much closer to recent sold prices per square foot. For homeowners, June’s decision point is price range: lower ranges remain more aligned, while luxury sellers face the widest pricing resistance among the five featured cities.
Key Takeaways
- Closed sales matched last June exactly at 136, a 0.0% year-over-year change that ends Bonita Springs’s eleven-month streak of growth without registering an actual decline.
- Active inventory fell 29.3% year over year to 860 listings, the steepest inventory drop of any city in this series, while months of supply eased to 5.5.
- Re-list Rate stands at 24.3%, with a $74,900 median per-property difference between the original asking price from the prior attempt and the final sale price, effectively tied with Naples’s $75,000 for the widest among the five featured cities.
- Competitive Inventory runs 1.5 months, showing real supply behind the overall figure is far tighter than the published 5.5-month supply figure suggests.
- Bonita Springs carries the widest blended Ask-Bid Gap among the five featured cities at 18.6%, driven by the luxury tier, where median asking price per square foot sits 40.2% above median sold price per square foot, more than double every other tier.
Regional Snapshot at a Glance
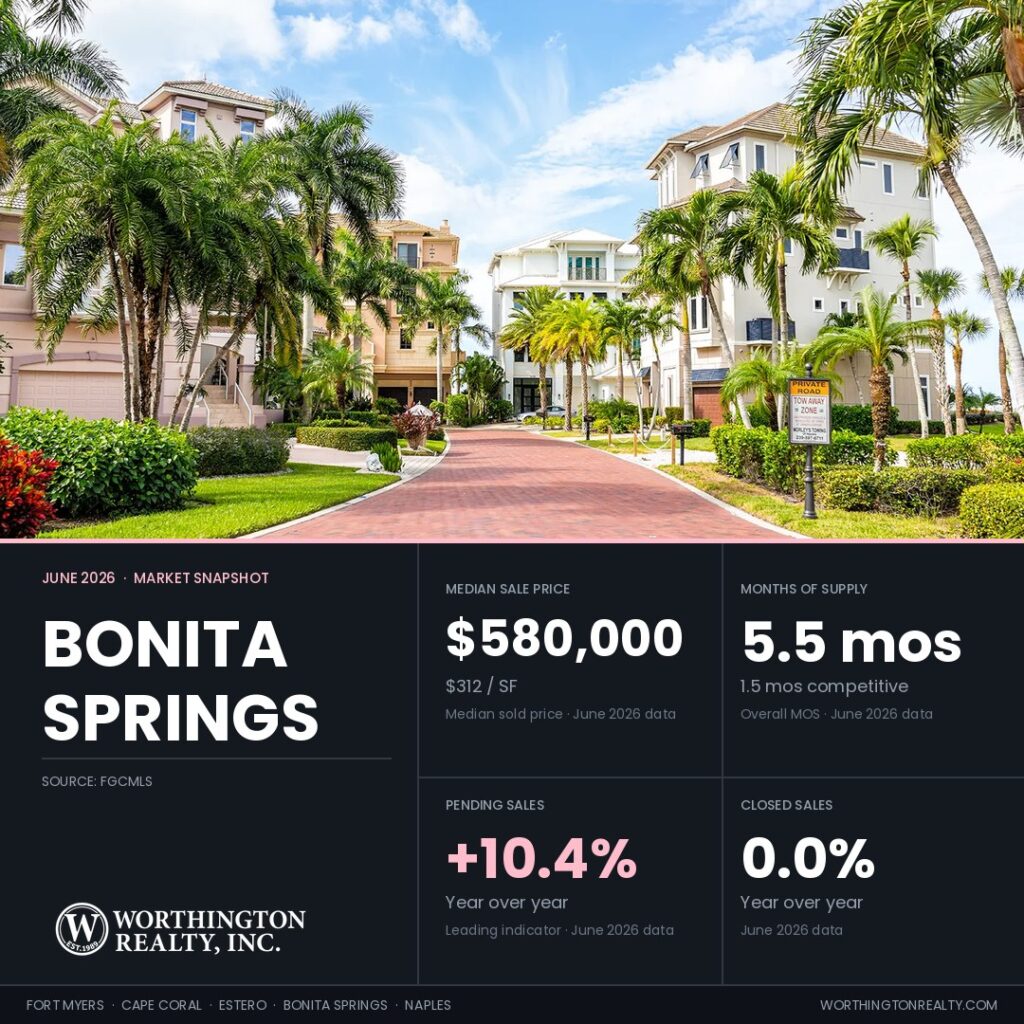
Here is how Bonita Springs compares with the other featured cities and the broader Southwest Florida market. All year-over-year (YoY) columns compare against June 2025. A negative price or PPSF change means prices fell; a negative inventory or supply change means fewer homes were available than a year ago.
| City | Median Sold Price | Median YoY | Price/SF | Price/ SF YoY | Active Listings | Active YoY | Months Supply | Months Supply YoY | Sold-to-List | Closed Sales | Closed YoY |
|---|---|---|---|---|---|---|---|---|---|---|---|
| Fort Myers | $330,000 | -7.0% | $194 | -6.7% | 2,767 | -23.8% | 6.0 | -31.8% | 95.9% | 500 | +3.5% |
| Cape Coral | $375,000 | +3.0% | $217 | +0.5% | 2,631 | -28.1% | 5.2 | -36.6% | 97.8% | 531 | +3.7% |
| Estero | $525,000 | -5.4% | $245 | -6.1% | 518 | -27.8% | 4.1 | -41.4% | 95.7% | 123 | +26.8% |
| Bonita Springs | $580,000 | +3.4% | $312 | +0.3% | 860 | -29.3% | 5.5 | -43.3% | 96.1% | 136 | 0.0% |
| Naples | $619,000 | +4.9% | $344 | +2.7% | 4,582 | -23.1% | 6.1 | -37.1% | 95.1% | 783 | +9.5% |
| Southwest Florida | $410,000 | +2.5% | $233 | -1.7% | 16,811 | -22.6% | 6.1 | -33.7% | 96.3% | 2,848 | +3.2% |
Source: FGCMLS. Single-month data unless otherwise noted. Sold-to-list uses most recent list price at time of contract.
Southwest Florida figures cover the full FGCMLS footprint, including areas outside the five featured cities. This row is calculated from the full regional dataset, not an average of the five city rows above.
New Listings, Active Supply, and What’s Coming to Market
Bonita Springs entered July with fewer new listings and a larger pending pool, though its absorption ratios remain the lowest among the five cities.
New listings fell to 134 in June from 160 a year ago, a 16.3% decline, the steepest new-supply drop of any city in this series. Active inventory dropped to 860, down from 1,217 a year ago, a 29.3% decrease. Months of supply came in at 5.5, using the standard 12-month sales pace.
Pending sales rose to 167, up 10.4% year over year, putting the Pending-to-Active Ratio at 20.3%, about 20 pending contracts for every 100 active listings, the lowest of the five cities. Against the trailing three-month closing pace of 197.0 sales, pending sales equal 84.8% of that pace, also the lowest among the five featured cities. Showings per listing came in at 2.9, up from 2.5 a year ago.
Bonita Springs had the lowest Pending-to-Active Ratio and the lowest pending count relative to recent closing pace among the five featured cities. The largest pricing mismatch appears above $1.5 million, where the Ask-Bid Gap reaches 40.2%.
Higher-Value Closings Lift Dollar Volume While Prices Hold
Median sale price versus price per square foot tell different stories. Because Bonita Springs’s monthly transaction volume runs lower than Fort Myers, Cape Coral, or Naples, Worthington also tracks a three-month rolling figure for this market.
Bonita Springs’s single-month median sale price rose 3.4% year over year to $580,000, while price per square foot rose 0.3% to $312. The three-month rolling figures were $560,000 for median price and $313 for price per square foot, both close to the single-month readings. That stability follows a real bottom, not a flat line the whole way through. Bonita Springs’s supply peaked in April 2025, rolling price per square foot bottomed at $304 about five months later, and has recovered 3.0% since, a pattern that matches Naples and Estero.
Dollar volume rose 18.8% year over year to $124.7 million, the strongest dollar-volume growth of any city in this series. With closings unchanged at 136, that increase came from a higher average transaction value. Luxury sales also represented a larger share of June closings than of the trailing 120-day pool. Homes sold for a median 96.1% of their most recent asking price, after any earlier price reductions, the sold-to-list ratio, up from 94.7% a year ago, indicating sellers are getting closer to their most recent asking price than they were twelve months ago.
Lower inventory supports sellers, but the benefit varies by price range. Bonita Springs still has the weakest pending activity relative to supply among the five featured cities, while luxury asking prices remain far above recent sales. At Bonita Springs’s $580,000 median price, a buyer putting 20% down and financing $464,000 at the current 6.43% rate on Freddie Mac’s Primary Mortgage Market Survey would carry a principal-and-interest payment of about $2,911 a month, before property taxes, insurance, or HOA dues.
The Cost of Missing the Price the First Time in Bonita Springs
In practical terms, these are homes that were listed before, left the MLS without a sale, and later came back on the market. Worthington’s Re-list Rate measures the share of today’s active listings that also had an expired, withdrawn, or terminated listing during the preceding 12 months. This section’s active-listing count comes from Worthington’s address-matched property export, which can differ slightly from the published monthly market statistics above.
Of Bonita Springs’s 824 active listings, 200 (24.3%) have previously expired, been withdrawn, or terminated in the past 12 months and returned to market. Of those relisted listings, 67.0% came back at least 3% below their prior asking price, the highest correction share among the five cities. The remaining 33.0% are stubborn relists, excluded from Competitive Inventory regardless of current days on market.
Among homes that sold in the trailing 120 days after relisting, the median original asking price was $629,000 and the median final sale price was $550,000. The dollar difference between the two, calculated per home, is $74,900, effectively tied with Naples for the largest relist cost among the five featured cities. Combined days on market across both listing attempts ran a median of 262 days, the longest combined exposure of any city in this series, compared with 63 days for homes that sold on the first attempt at a median price of $570,000. These citywide medians combine all property types and price tiers; segment-level results may differ.
Competitive Inventory Reveals the Luxury Tier Is Where Bonita Springs Pricing Breaks Down
Several supply numbers appear in this report. They are not contradictory, they answer different questions. Published months of supply stands at 5.5 and uses the standard 12-month sales pace. Worthington’s Competitive Inventory analysis uses the more recent three-month pace and removes long-stale listings, homes that have sat at least 180 days without a meaningful price reduction, and stubborn relists that returned at nearly the same price.
How Much Inventory Is Truly Competitive in Bonita Springs?
Using that recent sales pace, removing long-stale listings leaves 3.2 months of supply in Bonita Springs. Applying the full Competitive Inventory filter reduces the figure to 1.5 months. Fresh, first-attempt listings that sold did so in a median of 63 days.
How Bonita Springs Asking Prices Compare With Recent Sales
The Ask-Bid Gap compares the median asking price per square foot of current listings with the median price per square foot from recent sales. A positive gap means current listings are asking more per square foot than recent sales closed at; a negative gap means they are asking less. Bonita Springs’s citywide Ask-Bid Gap of 18.6% is the widest among the five featured cities, but a citywide figure this wide almost always hides an uneven distribution, and Bonita Springs is a clear example.
Entry-level listings under $400,000 carry a 15.4% Ask-Bid Gap, mid-range listings run 9.7%, and upper-mid listings run 7.9%, a substantially narrower range across the first three tiers. The luxury tier above $1.5 million, 172 active listings against 103 closings over the trailing 120 days, runs 40.2%, more than double any other tier in this city and wider than any single tier anywhere else in this series. Luxury listings that remain near the upper end of the current asking range face the greatest buyer resistance.
Shadow Inventory as of July 1
These homes are not currently listed for sale. Worthington tracks them because some may return and add future supply. In this report, shadow inventory consists of properties that left the market without a recorded sale through expiration, withdrawal, or termination and had not returned to active, pending, or closed status by July 1. Some may return to the market; others may not. Of the 1,324 properties in Bonita Springs’s trailing 12-month pool, 943 had not returned by July 1. The pool builds month by month as additional listings expire, withdraw, or terminate.
That trailing 12-month figure is different from the more recent, smaller group below. In just the last 30 days, 175 Bonita Springs properties expired, withdrew, or terminated, and only 10 of those, 5.7%, had returned to active status, gone pending, or sold by July 1, the lowest same-period return rate among the five featured cities. The remaining 165 had not returned as of July 1.
Insurance Conditions to Verify Before Offering
Florida’s homeowners insurance market has been recovering, with statewide rate increases easing from roughly 22% two years ago to under 1% today, though high-exposure coastal properties can still see steeper renewals. That distinction matters along the Imperial River, Bonita Bay, and Barefoot Beach flood-exposure corridors, so buyers there should confirm coverage costs before writing an offer rather than at closing.
Worthington Market Lens
The Worthington Market Lens compares the five featured cities using the same address-level measures. Lower Competitive Inventory means less serious competition for a well-priced seller. A smaller Ask-Bid Gap means asking prices are closer to recent sales. A higher Re-list Rate means more current listings have already been through an earlier listing attempt. A higher Pending-to-Active Ratio means more homes are under contract relative to the number for sale.
| City | Competitive Inventory (Months) | Re-list Rate | Ask-Bid Gap (Price/SF) | Pending-to-Active Ratio | Median Days to Contract, First Attempt | Median Total Days, Relisted |
|---|---|---|---|---|---|---|
| Fort Myers | 2.0 | 25.8% | 5.7% | 22.0% | 57 | 229.5 |
| Cape Coral | 2.1 | 22.4% | 11.3% | 29.7% | 46.5 | 216 |
| Estero | 1.4 | 20.9% | 4.0% | 28.3% | 58.5 | 253 |
| Bonita Springs | 1.5 | 24.3% | 18.6% | 20.3% | 63 | 262 |
| Naples | 1.8 | 23.4% | 11.2% | 22.9% | 60 | 241 |
Source: FGCMLS. Full definitions for each metric are in Worthington’s market methodology.
Bonita Springs Membership and Home Type Shape Community Pricing
How to read the community data: June activity counts cover status changes during June. Active and pending figures are snapshots as of July 1. Pricing and marketing-time figures use closings from the preceding 120 days. Starting this cycle, Re-list Rate is calculated by matching each active listing’s address against expired, withdrawn, and terminated records from the preceding 12 months. Prior cycle figures used expired and withdrawn only, so this cycle’s Re-list Rate figures are not directly comparable to prior month on a point-change basis.
Spanish Wells Golf and Country Club
- Active Listings: 28 (down 22.2% MoM)
- Closings (Last 120 Days): 28 (down 12.5% MoM)
- Pending Contracts: 10 (up 11.1% MoM)
- Pending-to-Active Ratio: 35.7% (up 10.7 pts MoM)
- Re-list Rate: 25.0%
- Months of Inventory: 4.0 (down 0.5 mos MoM)
- Median Sold Price: $625,000 (flat MoM)
- Sellers Received (Median): 96.4% of final list price (down 0.7 pts MoM)
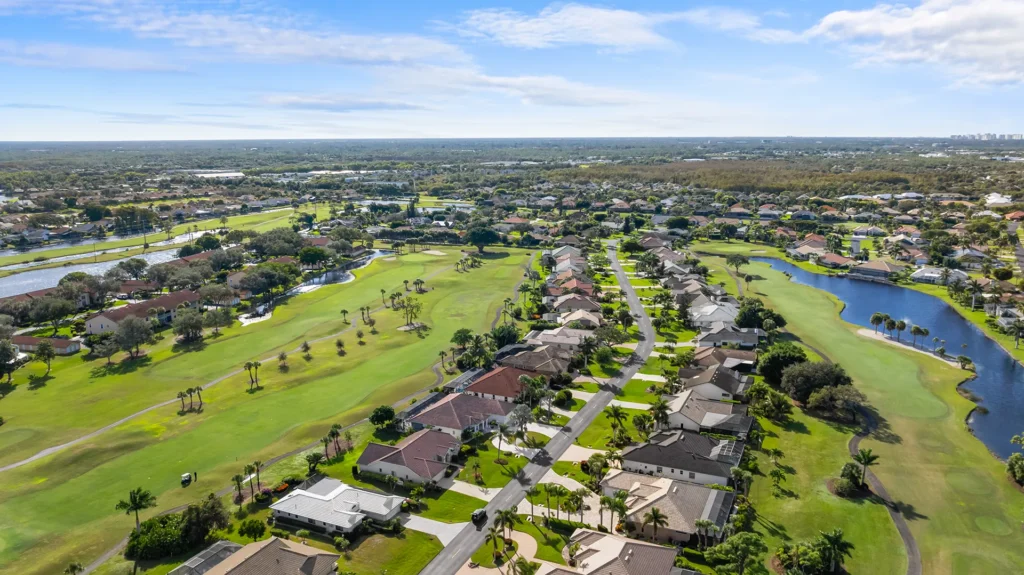
Spanish Wells, resident-owned since 2018 with seven membership levels from social to full golf, is made up of four sub-communities that trade at distinct price points. Cordova, Toll Brothers construction from 2015 to 2016, closed at a $960,000 median over the past 120 days. Spanish Wells proper, a mix of homes built from the 1980s through the early 2000s, closed at $875,000. Marbella, mid-rise condominiums built around 2004, closed at $432,000. Las Brisas closed at $310,000. During June, 6 homes closed, 3 expired, and 2 terminated. As of July 1, 28 listings were active and 10 were pending. The community-wide $625,000 blends all four together, but buyers should focus their comparable search on the specific sub-community they’re targeting.
Search Spanish Wells homes for sale
Bonita National Golf and Country Club
- Active Listings: 33 (down 5.7% MoM)
- Closings (Last 120 Days): 47 (down 4.1% MoM)
- Pending Contracts: 8 (down 42.9% MoM)
- Pending-to-Active Ratio: 24.2% (down 15.8 pts MoM)
- Re-list Rate: 9.1%
- Months of Inventory: 2.8 (flat MoM)
- Median Sold Price: $750,000 (flat MoM)
- Sellers Received (Median): 97.1% of final list price (up 0.5 pts MoM)
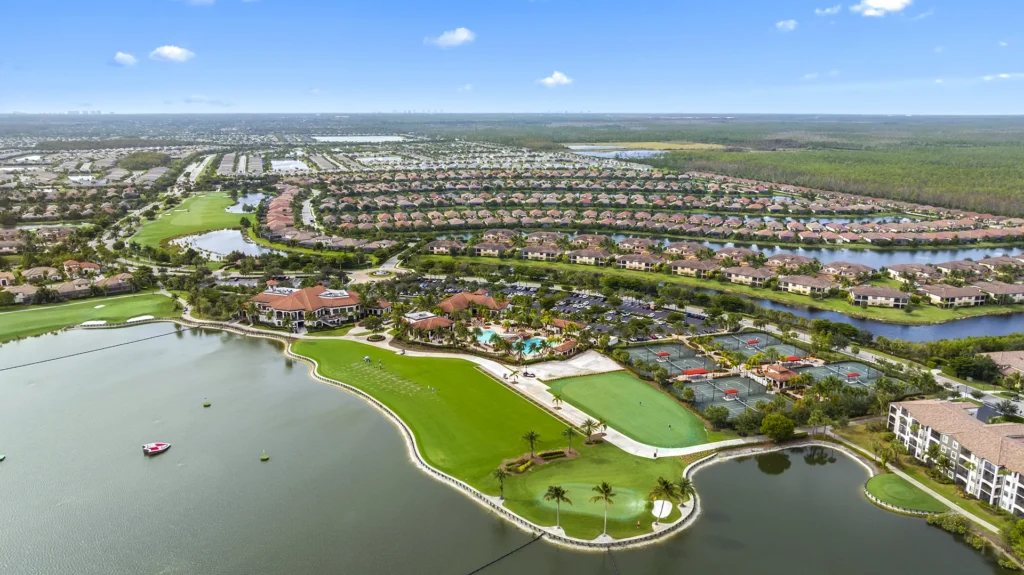
Bonita National is a bundled golf community in east Bonita Springs developed by Lennar, with condos, coach homes, and estate homes; deed type determines whether each property carries a full golf membership or social membership only. Three of the 33 active listings matched a terminated record from the preceding 12 months; none matched an expired or withdrawn record. All three are priced above $895,000. During June, 9 homes closed, 2 expired, 1 terminated, and 2 withdrew. As of July 1, 33 listings were active and 8 were pending. Active listings ask a $629,000 median against a $750,000 closed median, as available inventory skews toward condos and coach homes while recent closings included more single-family homes. Buyers must verify deed type before using any comparable closing as a pricing reference.
Search Bonita National homes for sale
Pelican Landing (excluding The Colony)
- Active Listings: 27 (down 20.6% MoM)
- Closings (Last 120 Days): 60 (down 17.8% MoM)
- Pending Contracts: 10 (up 42.9% MoM)
- Pending-to-Active Ratio: 37.0% (up 16.4 pts MoM)
- Re-list Rate: 37.0%
- Months of Inventory: 1.8 (flat MoM)
- Median Sold Price: $580,000 (down 3.3% MoM)
- Sellers Received (Median): 94.9% of final list price (down 0.7 pts MoM)
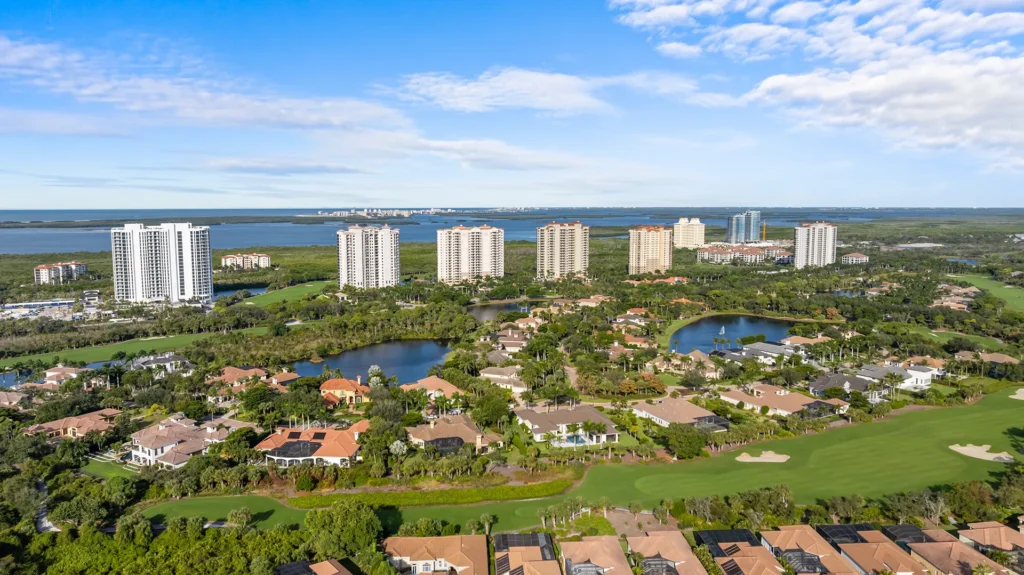
Pelican Landing is a 2,365-acre coastal master community west of US-41 in Bonita Springs, with optional Tom Fazio golf, a private beach island reached by community shuttle, and a product mix from condos and villas to single-family estate homes. During June, 6 homes closed and 9 listings expired, terminated, or withdrew in Pelican Landing proper. As of July 1, 27 listings were active and 10 were pending. The Colony at Pelican Landing closed 27 homes at a $1,400,000 median over the past 120 days; evaluate it with its own comparables. Within Pelican Landing proper, the $580,000 median and $575,000 active asking median are closely aligned. The 42-day median time to contract is based on 57 of 60 records. With 37.0% of active listings having previously expired, withdrew, or terminated, buyers should request the full listing history before offering. Sellers below $700,000 should price near recent closings.
Search Pelican Landing homes for sale
Seasons at Bonita
- Active Listings: 12 (down 14.3% MoM)
- Closings (Last 120 Days): 19 (up 18.8% MoM)
- Pending Contracts: 8 (up 33.3% MoM)
- Pending-to-Active Ratio: 66.7% (up 23.8 pts MoM)
- Re-list Rate: 41.7%
- Months of Inventory: 2.5 (down 1.0 mos MoM)
- Median Sold Price: $550,000 (down 5.5% MoM)
- Sellers Received (Median): 96.5% of final list price (flat MoM)
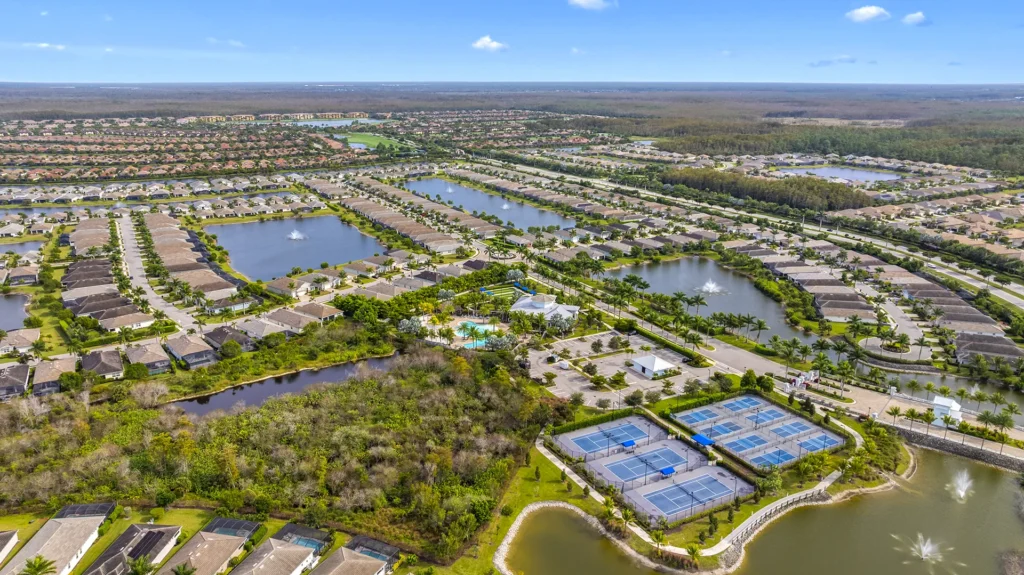
Seasons at Bonita is an all-ages, no-golf community on Bonita Beach Road, built entirely by D.R. Horton between 2018 and 2023, with 548 single-family homes and no condos. Eight homes were under contract while 12 were active as of July 1. During June, 4 homes closed, 2 expired, 1 terminated, and 1 withdrew. Current active listings ask a $737,000 median while the 19 closings over the past 120 days settled at $550,000, a $187,000 spread that likely reflects a current active pool weighted toward larger floor plans. With 41.7% of active listings having previously expired, withdrew, or terminated, buyers should request the full listing history before offering, since DOM resets when a property relists. Sellers should use recent comparable closings of the same floor plan as their pricing reference.
Search Seasons at Bonita homes for sale
Valencia Bonita
- Active Listings: 18 (down 14.3% MoM)
- Closings (Last 120 Days): 24 (down 7.7% MoM)
- Pending Contracts: 2 (down 75.0% MoM)
- Pending-to-Active Ratio: 11.1% (down 27.0 pts MoM)
- Re-list Rate: 38.9%
- Months of Inventory: 3.0 (down 0.2 mos MoM)
- Median Sold Price: $777,500 (down 4.3% MoM)
- Sellers Received (Median): 95.6% of final list price (flat MoM)
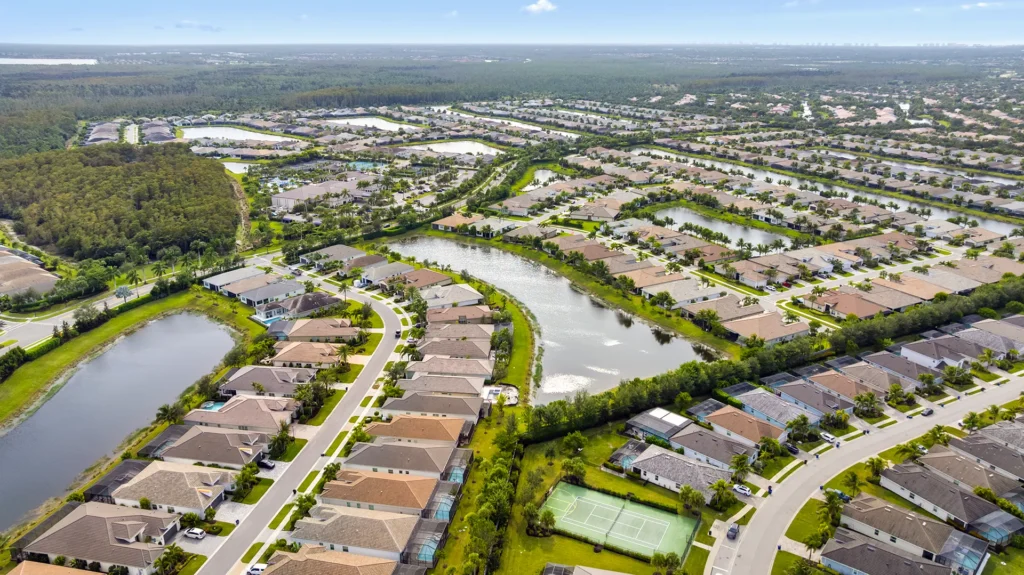
Valencia Bonita is a 55-plus, no-golf community on Bonita Beach Road developed by GL Homes, with detached single-family homes and attached twin villas around a 45,000-square-foot clubhouse complex. Pending contracts fell from 8 to 2. During June, 5 homes closed and 6 listings expired, terminated, or withdrew. As of July 1, 18 listings were active and 2 were pending. The $777,500 closed median eased 4.3%; active listings ask about $729,000, below the closed figure, as available inventory skews toward attached villas while recent closings included more single-family homes. With 38.9% of active listings having previously expired, withdrew, or terminated, buyers should request the full listing history before offering. With only 2 pending contracts against 18 active listings, buyers have more time to evaluate than in May.
Search Valencia Bonita homes for sale
VillageWalk of Bonita Springs
- Active Listings: 10 (down 16.7% MoM)
- Closings (Last 120 Days): 35 (down 5.4% MoM)
- Pending Contracts: 8 (down 27.3% MoM)
- Pending-to-Active Ratio: 80.0% (down 11.7 pts MoM)
- Re-list Rate: 10.0%
- Months of Inventory: 1.1 (down 0.2 mos MoM)
- Median Sold Price: $510,000 (down 3.3% MoM)
- Sellers Received (Median): 97.2% of final list price (up 0.3 pts MoM)
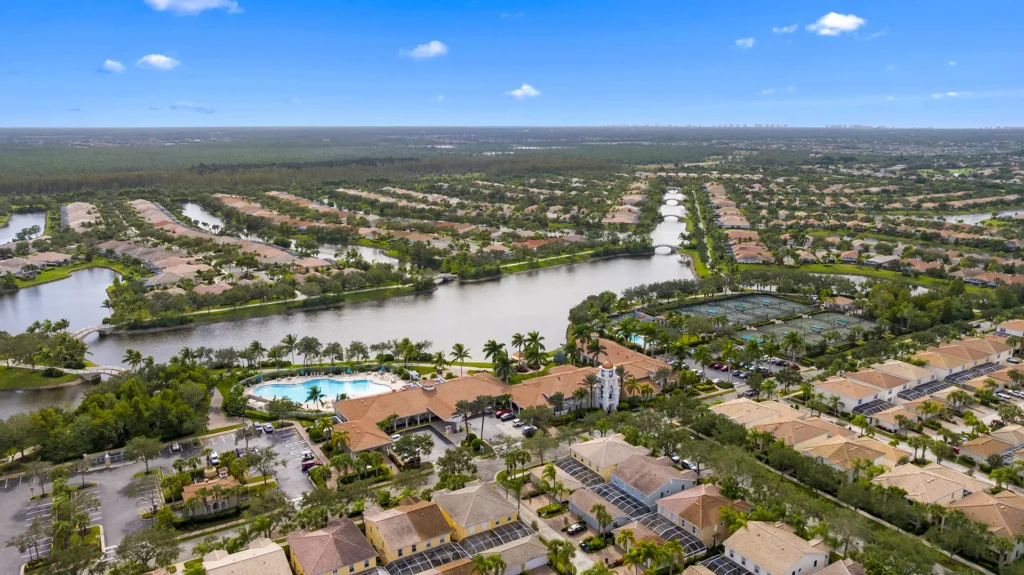
VillageWalk of Bonita Springs is an all-ages DiVosta community on 500 acres with an on-site Town Center, Venetian-style canals, three housing types from townhomes to single-family homes, and poured-solid concrete construction throughout. Eight homes were under contract while only 10 were active as of July 1. During June, 7 homes closed and 1 expired. Only 1 of the 10 active listings matched a property that previously expired, withdrew, or terminated. Active listings ask a $551,500 median while recent closings settled at $510,000; active listings average 1,731 square feet against 1,868 for recent closings, with active listings and recent closings sharing a 2006 median year built. The 50-day median time to contract is based on 34 of 35 records. Model, condition, and lake view matter more than size or age when selecting comparable sales here.
Search VillageWalk of Bonita Springs homes for sale
Sellers Received reflects final sold price divided by the most recent list price at the time of contract, not the original asking price before reductions.
Frequently Asked Questions
It depends heavily on price range. Entry, mid, and upper-mid listings range from 7.9% to 15.4% Ask-Bid Gap, more closely aligned with recent sold prices per square foot than the luxury tier. The luxury tier above $1.5 million runs a 40.2% Ask-Bid Gap.
If the home is above $1.5 million, the 40.2% tier-level spread makes price alignment the first issue to examine. Across all Bonita Springs relists, 67.0% returned at least 3% below their prior asking price.
Offer strategy depends heavily on price tier. Bonita Springs’s overall sold-to-list ratio was 96.1%, while the luxury tier carries a much wider price-per-square-foot spread at 40.2%. Recent comparable sales, property condition, market time, and prior reductions should determine the actual offer.
First-attempt listings that sold did so in a median of 63 days, the longest first-attempt pace among the five featured cities. Relisted homes that eventually sold took a median of 262 combined days, the longest combined exposure of any city in this series.
June closings matched last June exactly at 136, while dollar volume rose 18.8%, the largest increase among the five featured cities.
Track the Southwest Florida Market in Real Time
Create a free account to save searches and receive alerts on new listings, price reductions, and status changes for the homes you’re watching across Fort Myers, Cape Coral, Estero, Bonita Springs, and Naples.
The Bottom Line for Bonita Springs
Bonita Springs ended June with 29.3% fewer homes for sale than a year ago, but the effect varies sharply by price range. The 40.2% luxury Ask-Bid Gap calls for early price discipline and property-level comparison above $1.5 million. Lower tiers remain more closely aligned with recent sold prices per square foot, though sellers there should still price from comparable sales within the correct product category. Most homeowners feel overwhelmed when it’s time to move. At Worthington Realty, we provide personalized guidance and clear communication so that you feel heard, valued, and confident in your decisions.
Search Bonita Springs homes for sale | Contact the Worthington Realty team | Get notified when next month’s report publishes
All data referenced in Worthington’s market reports draws from the Florida Gulf Coast MLS (FGCMLS via Stellar MLS) unless otherwise noted.
Data reflects MLS records available as of July 1, 2026. Figures may update as late-reported transactions are entered.
How to read the data: Published active inventory and standard months of supply come from the monthly market statistics. Worthington’s Re-list Rate and Pending-to-Active Ratio use the address-matched property export, so their active denominators may differ slightly. Competitive Inventory uses the trailing three-month closing pace.
Explore the June 2026 Southwest Florida Market Series
- Southwest Florida housing market report
- Fort Myers housing market report
- Cape Coral housing market report
- Estero housing market report
- Naples housing market report
Explore Homes for Sale and Learn About Living In: Fort Myers | Cape Coral | Estero | Bonita Springs | Naples
For a full explanation of the indicators used in this report, see how Worthington Realty analyzes the Southwest Florida housing market.
