


This is a past report. It covers Cape Coral market data for June 2026. For current numbers, see our Cape Coral housing market page.
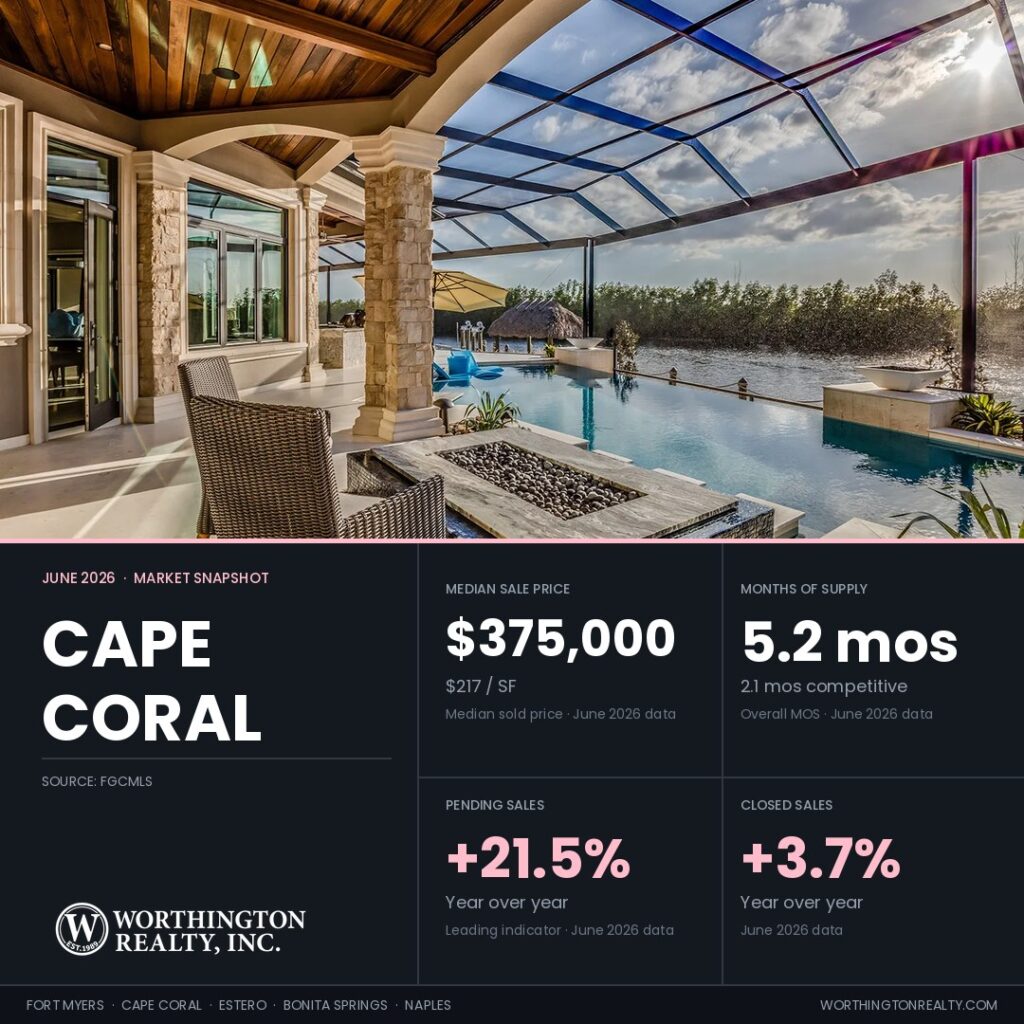
Pending sales rose 21.5% year over year, while June closings rebounded 3.7%.
June answered the question May left open in Cape Coral. Cape Coral had 767 pending contracts entering July, equal to 135.2% of the city’s recent monthly closing pace, even as active inventory fell 28.1%. Together, those measures suggest buyer demand held up while closings lagged. Cape Coral enters July with the strongest pending activity and the highest sold-to-list ratio among the five featured cities.
Key Takeaways
- Closed sales rose 3.7% year over year to 531 in June, reversing May’s decline.
- Active inventory fell 28.1% year over year to 2,631 listings, while months of supply eased to 5.2, and pending sales climbed 21.5% to put the Pending-to-Active Ratio at 29.7%, the strongest among the five featured cities.
- Cape Coral’s Re-list Rate stands at 22.4%, with a $34,900 median per-property difference between the original asking price from the prior attempt and the final sale price, the smallest relist cost among the five featured cities.
- Competitive Inventory runs 2.1 months, the widest Competitive Inventory figure among the five cities, even as the overall months-of-supply figure is one of the tighter ones.
- The sold-to-list ratio was 97.8%, the highest among the five featured cities.
Regional Snapshot at a Glance
Here is how Cape Coral compares with the other featured cities and the broader Southwest Florida market. All year-over-year (YoY) columns compare against June 2025. A negative price or PPSF change means prices fell; a negative inventory or supply change means fewer homes were available than a year ago.
| City | Median Sold Price | Median YoY | Price/SF | Price/ SF YoY | Active Listings | Active YoY | Months Supply | Months Supply YoY | Sold-to-List | Closed Sales | Closed YoY |
|---|---|---|---|---|---|---|---|---|---|---|---|
| Fort Myers | $330,000 | -7.0% | $194 | -6.7% | 2,767 | -23.8% | 6.0 | -31.8% | 95.9% | 500 | +3.5% |
| Cape Coral | $375,000 | +3.0% | $217 | +0.5% | 2,631 | -28.1% | 5.2 | -36.6% | 97.8% | 531 | +3.7% |
| Estero | $525,000 | -5.4% | $245 | -6.1% | 518 | -27.8% | 4.1 | -41.4% | 95.7% | 123 | +26.8% |
| Bonita Springs | $580,000 | +3.4% | $312 | +0.3% | 860 | -29.3% | 5.5 | -43.3% | 96.1% | 136 | 0.0% |
| Naples | $619,000 | +4.9% | $344 | +2.7% | 4,582 | -23.1% | 6.1 | -37.1% | 95.1% | 783 | +9.5% |
| Southwest Florida | $410,000 | +2.5% | $233 | -1.7% | 16,811 | -22.6% | 6.1 | -33.7% | 96.3% | 2,848 | +3.2% |
Source: FGCMLS. Single-month data unless otherwise noted. Sold-to-list uses most recent list price at time of contract.
Southwest Florida figures cover the full FGCMLS footprint, including areas outside the five featured cities. This row is calculated from the full regional dataset, not an average of the five city rows above.
New Listings, Active Supply, and What’s Coming to Market
Cape Coral’s June pipeline provides the clearest evidence that buyer activity held up after May.
New listings fell to 664 in June from 704 a year ago, a 5.7% decline. Active inventory dropped to 2,631, down from 3,659 a year ago, a 28.1% decrease. Months of supply came in at 5.2, using the standard 12-month sales pace.
Pending sales rose to 767, up 21.5% year over year, putting the Pending-to-Active Ratio at 29.7%, about 30 pending contracts for every 100 active listings, the highest of the five featured cities. June’s rebound suggests May’s decline was temporary, with demand indicators remaining firm this month. Against the trailing three-month closing pace of 567.3 sales, pending sales equal 135.2% of that pace, the strongest among the five featured cities. Showings per listing came in at 4.2, the highest among the five featured cities, though down from 5.5 a year ago as the exceptionally high spring pace normalized.
Falling new listings combined with a pending pool running at 135.2% of the recent closing pace mean less competition is arriving even as demand holds, though that same tightness, paired with a 97.8% sold-to-list ratio, leaves buyers less room to negotiate than in most of the five featured cities.
Cape Coral Median Price and Price Per Square Foot Both Rise Modestly
Median sale price versus price per square foot tell different stories. Median sale price moves when the mix of homes closing changes. Price per square foot normalizes for home size, making it the more reliable read on what is actually happening to values.
Cape Coral’s median sale price rose 3.0% year over year to $375,000, while price per square foot ticked up 0.5% to $217. Both measures support modest price stability. That stability arrived later here than in most of the other cities in this series. Cape Coral’s supply peaked in February 2025, but price per square foot did not bottom until March of this year, thirteen months later, the longest lag of any city Worthington tracks. It has recovered 5.3% since that low, a turn that is real but still recent.
Dollar volume rose 9.2% year over year to $243.7 million. Homes sold for a median 97.8% of their most recent asking price, after any earlier price reductions, up from 97.5% a year ago and the highest sold-to-list ratio among the five featured cities, meaning Cape Coral sellers are getting closer to their most recent asking price than anywhere else among the five featured cities.
For sellers, a stable price picture combined with the tightest sold-to-list ratio among the five featured cities means well-priced Cape Coral listings are closing near ask. For buyers, that same tightness means less negotiating room here than in the Fort Myers or Estero housing markets. At Cape Coral’s $375,000 median price, a buyer putting 20% down and financing $300,000 at the current 6.43% rate on Freddie Mac’s Primary Mortgage Market Survey would carry a principal-and-interest payment of about $1,882 a month, before property taxes, insurance, or HOA dues.
The Cost of Missing the Price the First Time in Cape Coral
In practical terms, these are homes that were listed before, left the MLS without a sale, and later came back on the market. Worthington’s Re-list Rate measures the share of today’s active listings that also had an expired, withdrawn, or terminated listing during the preceding 12 months. It tells us how Cape Coral sellers as a group are responding to current conditions. This section’s active-listing count comes from Worthington’s address-matched property export, which can differ slightly from the published monthly market statistics above.
Of Cape Coral’s 2,579 active listings, 578 (22.4%) have previously expired, been withdrawn, or terminated in the past 12 months and returned to market. Of those relisted listings, 56.4% came back at least 3% below their prior asking price, evidence that most sellers who relist are adjusting to the market rather than trying the same price again. The remaining 43.6% are stubborn relists, excluded from Competitive Inventory regardless of current days on market.
Among homes that sold in the trailing 120 days after relisting, the median original asking price was $449,900 and the median final sale price was $410,000. The dollar difference between the two, calculated per home, is $34,900, the smallest relist cost of the five cities in this series. Combined days on market across both listing attempts ran a median of 216 days, compared with 46.5 days for homes that sold on the first attempt at a median price of $360,000. Cape Coral’s relist cost is real, but it is the smallest among the five featured cities. These citywide medians combine all property types and price tiers; segment-level results may differ.
Competitive Inventory Shows What Cape Coral Sellers Are Actually Facing
Several supply numbers appear in this report. They are not contradictory, they answer different questions. Published months of supply stands at 5.2 and uses the standard 12-month sales pace. Worthington’s Competitive Inventory analysis uses the more recent three-month pace and removes long-stale listings, homes that have sat at least 180 days without a meaningful price reduction, and stubborn relists that returned at nearly the same price.
How Much Inventory Is Truly Competitive in Cape Coral?
Using that recent sales pace, removing long-stale listings leaves 3.7 months of supply in Cape Coral. Applying the full Competitive Inventory filter reduces the figure to 2.1 months. Fresh, first-attempt listings that sold did so in a median of 46.5 days.
How Cape Coral Asking Prices Compare With Recent Sales
The Ask-Bid Gap compares the median asking price per square foot of current listings with the median price per square foot from recent sales. A positive gap means current listings are asking more per square foot than recent sales closed at; a negative gap means they are asking less. The Ask-Bid Gap in Cape Coral, comparing median active asking price per square foot against median sold price per square foot over the trailing 120 days, sits at 11.3%. By tier, entry-level listings under $400,000 carry a 6.0% Ask-Bid Gap, mid-range listings sit tighter at 1.4%, upper-mid at 3.5%, and the luxury tier above $1.5 million runs 8.2%, wider than the mid-range band but not as extreme a spread as some other cities in this series show at the top end.
Shadow Inventory as of July 1
These homes are not currently listed for sale. Worthington tracks them because some may return and add future supply. In this report, shadow inventory consists of properties that left the market without a recorded sale through expiration, withdrawal, or termination and had not returned to active, pending, or closed status by July 1. Some may return to the market; others may not. Of the 3,968 properties in Cape Coral’s trailing 12-month pool, 2,887 had not returned by July 1. The pool builds month by month as additional listings expire, withdraw, or terminate. That trailing 12-month figure is different from the more recent, smaller group below. In just the last 30 days, 431 Cape Coral properties expired, withdrew, or terminated, and only 52 of those, 12.1%, had returned to active status, gone pending, or sold by July 1. The remaining 379 had not returned as of July 1.
Insurance Conditions to Verify Before Offering
Florida’s homeowners insurance market has been recovering, with statewide rate increases easing from roughly 22% two years ago to under 1% today. Cape Coral’s canal-front and flood-zone inventory still sees more scrutiny than inland homes, so buyers should confirm coverage costs before writing an offer rather than at closing.
Worthington Market Lens
The Worthington Market Lens compares the five featured cities using the same address-level measures. Lower Competitive Inventory means less serious competition for a well-priced seller. A smaller Ask-Bid Gap means asking prices are closer to recent sales. A higher Re-list Rate means more current listings have already been through an earlier listing attempt. A higher Pending-to-Active Ratio means more homes are under contract relative to the number for sale.
| City | Competitive Inventory (Months) | Re-list Rate | Ask-Bid Gap (Price/SF) | Pending-to-Active Ratio | Median Days to Contract, First Attempt | Median Total Days, Relisted |
|---|---|---|---|---|---|---|
| Fort Myers | 2.0 | 25.8% | 5.7% | 22.0% | 57 | 229.5 |
| Cape Coral | 2.1 | 22.4% | 11.3% | 29.7% | 46.5 | 216 |
| Estero | 1.4 | 20.9% | 4.0% | 28.3% | 58.5 | 253 |
| Bonita Springs | 1.5 | 24.3% | 18.6% | 20.3% | 63 | 262 |
| Naples | 1.8 | 23.4% | 11.2% | 22.9% | 60 | 241 |
Source: FGCMLS. Full definitions for each metric are in Worthington’s market methodology.
Cape Coral Waterfront and Gated Communities Require Different Comparables
How to read the community data: June activity counts cover status changes during June. Active and pending figures are snapshots as of July 1. Pricing and marketing-time figures use closings from the preceding 120 days. Starting this cycle, Re-list Rate is calculated by matching each active listing’s address against expired, withdrawn, and terminated records from the preceding 12 months. Prior cycle figures used expired and withdrawn only, so this cycle’s Re-list Rate figures are not directly comparable to prior month on a point-change basis.
Cape Harbour
- Active Listings: 32 (up 6.7% MoM)
- Closings (Last 120 Days): 14 (down 17.6% MoM)
- Pending Contracts: 1 (down 75.0% MoM)
- Pending-to-Active Ratio: 3.1% (down 10.2 pts MoM)
- Re-list Rate: 18.8%
- Months of Inventory: 9.1 (up 2.0 mos MoM)
- Median Sold Price: $490,000 (down 6.7% MoM)
- Sellers Received (Median): 93.9% of final list price (up 1.0 pts MoM)
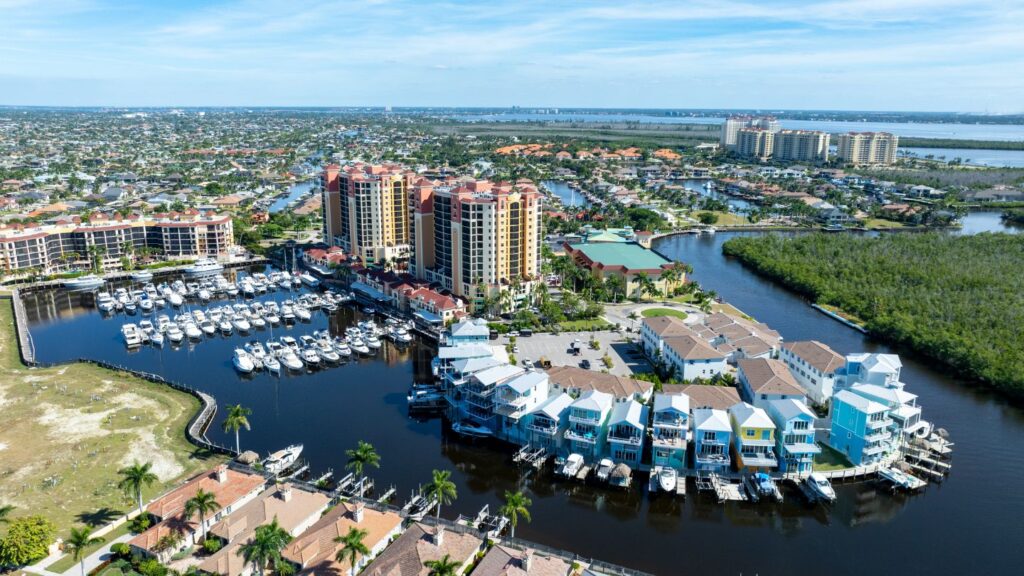
Cape Harbour is a deep-water marina community at the southern tip of Cape Coral, with direct Gulf access, a public waterfront boardwalk, and four property types from Marina South high-rise condos to Funky Fish Houses to gated estate homes on deep-water lots. During June, 3 homes closed and 3 expired or terminated. As of July 1, 32 listings were active and 1 was pending. 18.8% of active listings matched a property that previously expired, withdrew, or terminated. Active listings have been on market a median of 179 days while recent closings went under contract in 76 days. Months of supply reached 9.1. With one pending contract against 32 active listings, buyers have a strong basis for negotiation; start with listings that have accumulated the most market time and compare them against recent sales of the same property type.
Search Cape Harbour homes for sale
Cape Royal
- Active Listings: 10 (flat MoM)
- Closings (Last 120 Days): 12 (up 9.1% MoM)
- Pending Contracts: 2 (up 100.0% MoM)
- Pending-to-Active Ratio: 20.0% (up 10.0 pts MoM)
- Re-list Rate: 50.0%
- Months of Inventory: 3.3 (down 0.3 mos MoM)
- Median Sold Price: $615,000 (flat MoM)
- Sellers Received (Median): 97.3% of final list price (up 0.3 pts MoM)
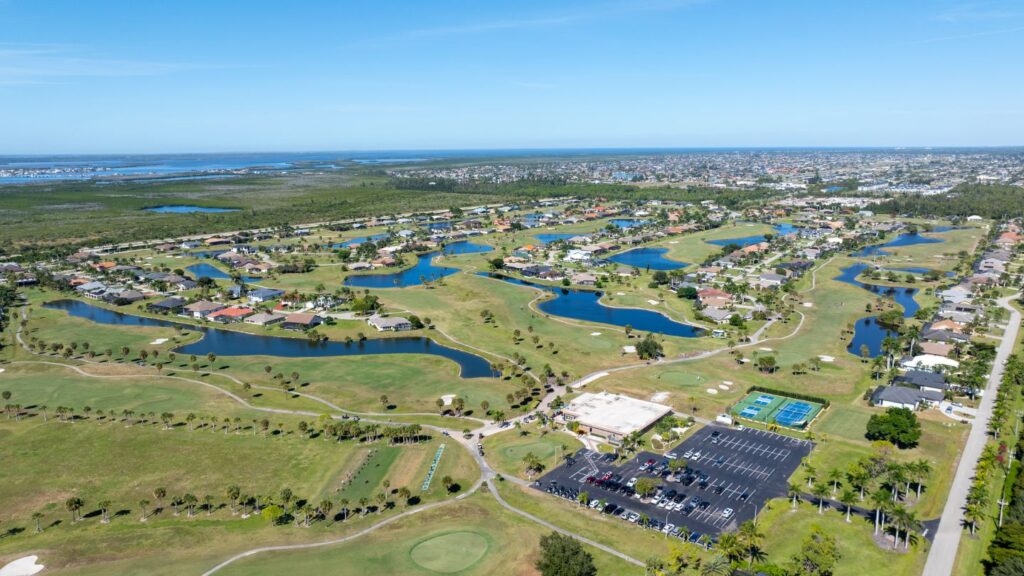
Cape Royal is the only gated golf community in Cape Coral, with 27 holes of optional golf on a resident-owned course, 483 detached single-family homes, and oversized lots throughout. With only 12 closings over the past 120 days, the $615,000 median can move with every transaction. During June, 1 home closed and 3 listings expired, terminated, or withdrew. As of July 1, 10 listings were active and 2 were pending. Active listings ask about $850,000 and have been on market a median of 121 days while recent closings went under contract in 36 days. With 50.0% of active listings having previously expired, withdrew, or terminated, buyers should request the full listing history before offering. Buyers should use comparable sales within the same section and home type.
Search Cape Royal homes for sale
Sandoval
- Active Listings: 21 (down 19.2% MoM)
- Closings (Last 120 Days): 45 (up 4.7% MoM)
- Pending Contracts: 12 (down 20.0% MoM)
- Pending-to-Active Ratio: 57.1% (flat MoM)
- Re-list Rate: 33.3%
- Months of Inventory: 1.9 (down 0.5 mos MoM)
- Median Sold Price: $355,000 (flat MoM)
- Sellers Received (Median): 95.9% of final list price (flat MoM)
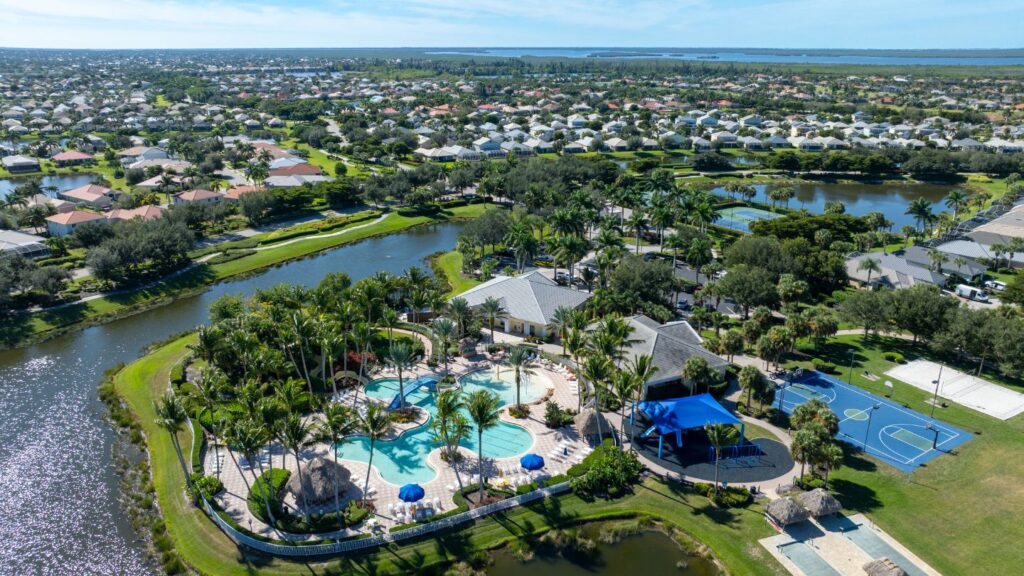
Sandoval is a Caribbean-inspired resort community in southwest Cape Coral with a 2-mile linear park, a resort pool complex, no golf, and a product mix from attached carriage villas to 4,000-square-foot single-family homes. Twelve homes were pending against 21 active listings as of July 1. During June, 11 homes closed and 6 listings expired, terminated, or withdrew. Active listings show a 2,202-square-foot median; the 45 closings over the past 120 days ran 1,726 square feet and settled in a median of 77 days, a size difference that accounts for most of the spread between the $469,000 active asking and $355,000 closed medians. With 33.3% of active listings having previously expired, withdrew, or terminated, buyers should request the full listing history before offering. Single-family sellers should use closings from similar models and lot types.
Search Sandoval homes for sale
Tarpon Point
- Active Listings: 9 (down 25.0% MoM)
- Closings (Last 120 Days): 9 (flat MoM)
- Pending Contracts: 1 (flat MoM)
- Pending-to-Active Ratio: 11.1% (up 2.8 pts MoM)
- Re-list Rate: 44.4%
- Months of Inventory: 4.0 (down 1.3 mos MoM)
- Median Sold Price: $720,000 (down 17.7% MoM)
- Sellers Received (Median): 95.1% of final list price (flat MoM)
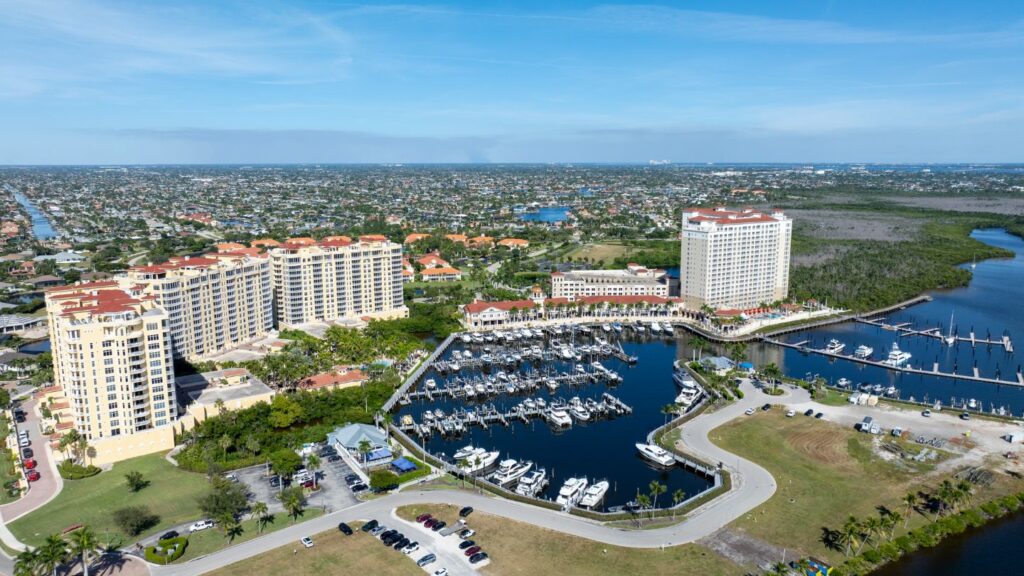
Tarpon Point is a luxury marina community at the southwest tip of Cape Coral, with direct river access to the Gulf, the adjacent Westin Cape Coral Resort, and four property types from 14-story waterfront condos in Tarpon Landings to custom deep-water estate homes. The 6 Tarpon Landings closings over the past 120 days settled at a $987,500 median; expired listings from the trailing 12-month pool asked about $1,250,000, suggesting asking price may be a factor. The 3 Tarpon Gardens closings went under contract in 12 days at a $665,000 median. During June, 2 homes closed and 2 expired. As of July 1, 9 listings were active and 1 was pending. With 44.4% of active listings having previously expired, withdrew, or terminated, buyers should request the full listing history before offering. Buyers should evaluate each section with its own comparable sales.
Search Tarpon Point homes for sale
Cape Coral Yacht Club
- Active Listings: 7 (down 46.2% MoM)
- Closings (Last 120 Days): 15 (up 25.0% MoM)
- Pending Contracts: 3 (down 25.0% MoM)
- Pending-to-Active Ratio: 42.9% (up 12.1 pts MoM)
- Re-list Rate: 42.9%
- Months of Inventory: 1.9 (down 2.4 mos MoM)
- Median Sold Price: $635,000 (down 0.8% MoM)
- Sellers Received (Median): 93.8% of final list price (down 0.9 pts MoM)
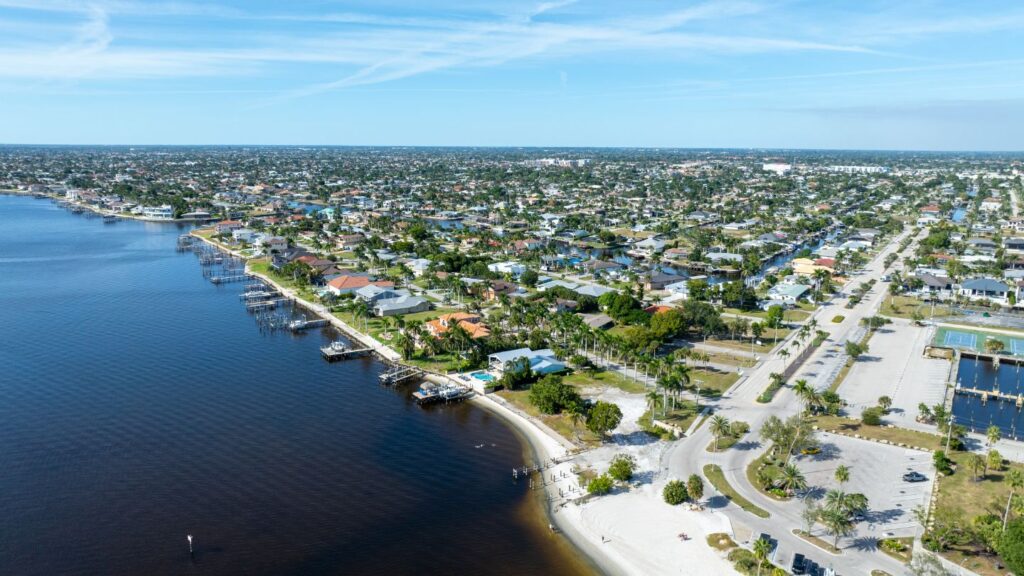
Cape Coral Yacht Club is Cape Coral’s original waterfront neighborhood, developed in the late 1950s with sailboat-access canals and no HOA or CDD, where original mid-century ranch homes and modern luxury estates sit side by side on the same streets. Active listings ask a $1,375,000 median; the 15 homes that closed over the past 120 days settled at $635,000. Four of the 7 active listings ask $1 million or more, pulling the active median well above where the market has been transacting. During June, 3 homes closed and 5 listings expired, terminated, or withdrew. As of July 1, 7 listings were active and 3 were pending. With 42.9% of active listings having previously expired, withdrew, or terminated, buyers should request the full listing history before offering. Comparable sales from nearby Gulf-access streets provide the most reliable pricing benchmark.
Search Cape Coral Yacht Club homes for sale
Sellers Received reflects final sold price divided by the most recent list price at the time of contract, not the original asking price before reductions.
Frequently Asked Questions
Yes, but with less negotiating room than most of the five featured cities. The sold-to-list ratio is 97.8%, the tightest of the five cities, and Competitive Inventory runs 2.1 months, the widest genuine-supply reading in this series.
Among Cape Coral relists, 56.4% returned at least 3% below their prior asking price, and the citywide relist cost is the smallest among the five featured cities at $34,900. At the property level, Gulf-access versus freshwater versus inland location, flood zone and insurance costs, roof age, canal width and bridge restrictions, and condition all affect how a specific home compares. Pricing should start with comparable sales from the correct waterfront category, then account for condition, insurance costs, and listing history.
Cape Coral’s 97.8% sold-to-list ratio and a relatively narrow entry-tier Ask-Bid Gap of 6.0% both point to less citywide negotiating room than in several nearby markets. Neither figure should be applied automatically to an individual property. Recent comparable sales, waterfront category, condition, market time, prior reductions, and insurance exposure should determine the actual offer.
First-attempt listings that sold did so in a median of 46.5 days, the fastest first-attempt pace among the five featured cities. Relisted homes that eventually sold took a median of 216 combined days.
Cape Coral posted the strongest Pending-to-Active Ratio among the five featured cities at 29.7%. June’s closing rebound suggests underlying demand remained intact through May’s slower closing month.
Track the Southwest Florida Market in Real Time
Create a free account to save searches and receive alerts on new listings, price reductions, and status changes for the homes you’re watching across Fort Myers, Cape Coral, Estero, Bonita Springs, and Naples.
The Bottom Line for Cape Coral
Cape Coral now has a clean answer to the question May’s data left open. Closings returned to year-over-year growth in June, rising 3.7%, pending sales rose 21.5%, and the sold-to-list ratio was 97.8%, the highest among the five featured cities. Sellers should price from recent comparable sales, while buyers should be prepared to act on listings that align closely with current transaction levels. Most homeowners feel overwhelmed when it’s time to move. At Worthington Realty, we provide personalized guidance and clear communication so that you feel heard, valued, and confident in your decisions.
Search Cape Coral homes for sale | Contact the Worthington Realty team | Get notified when next month’s report publishes
All data referenced in Worthington’s market reports draws from the Florida Gulf Coast MLS (FGCMLS via Stellar MLS) unless otherwise noted.
Data reflects MLS records available as of July 1, 2026. Figures may update as late-reported transactions are entered.
How to read the data: Published active inventory and standard months of supply come from the monthly market statistics. Worthington’s Re-list Rate and Pending-to-Active Ratio use the address-matched property export, so their active denominators may differ slightly. Competitive Inventory uses the trailing three-month closing pace.
Explore the June 2026 Southwest Florida Market Series
- Southwest Florida housing market report
- Fort Myers housing market report
- Estero housing market report
- Bonita Springs housing market report
- Naples housing market report
Explore Homes for Sale and Learn About Living In: Fort Myers | Cape Coral | Estero | Bonita Springs | Naples
For a full explanation of the indicators used in this report, see how Worthington Realty analyzes the Southwest Florida housing market.
