

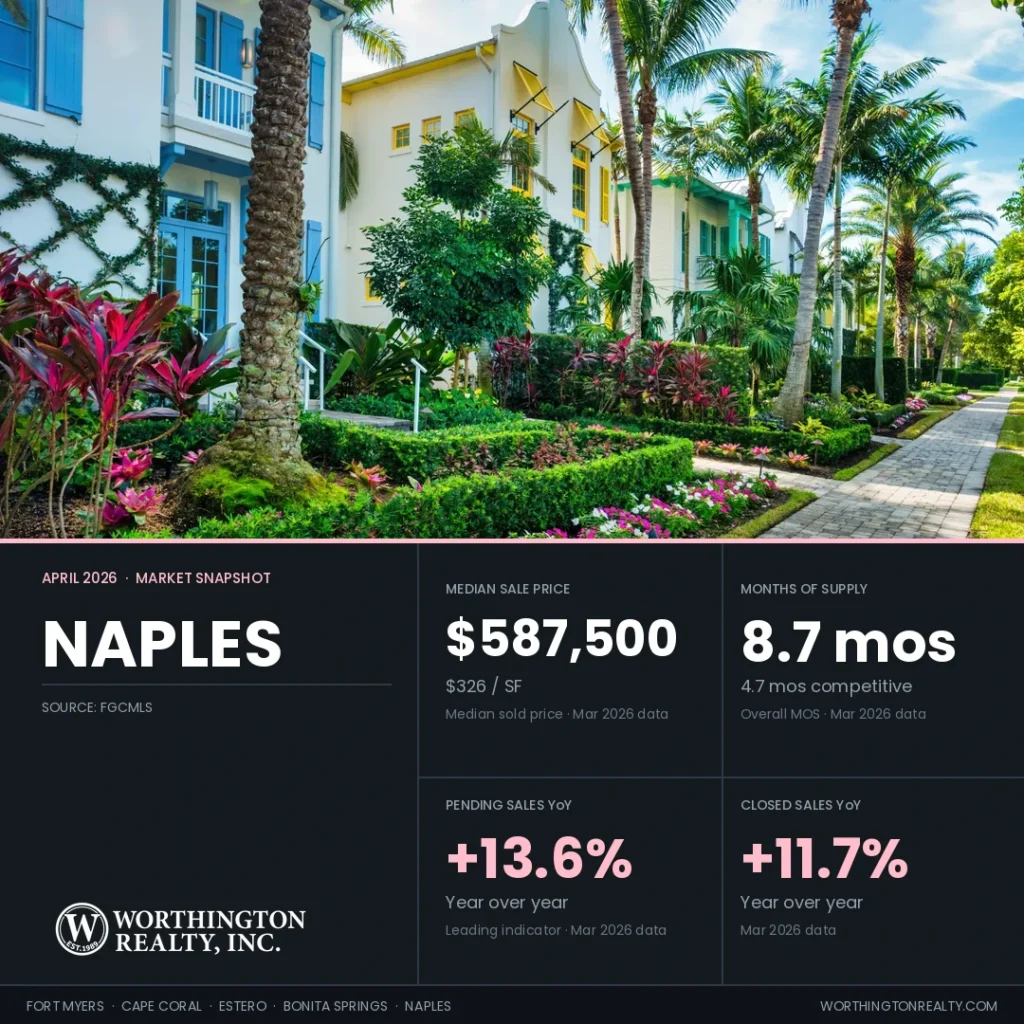
Naples Closed Sales Rose 11.7% While the Ask-Bid Gap Sits at 16%: Buyers Are Active, but Only at the Right Price
Data reflects MLS records as of April 1, 2026. MLS figures may update as late transactions are recorded.
Naples is the only city in the region with double-digit growth in both pending sales (+13.6% year over year) and closed sales (+11.7% year over year) simultaneously. It also carries the widest Ask-Bid Gap in Southwest Florida at 16.0% and the highest overall months of supply at 8.7. Buyers are active and closing when the price is right. The larger share of the active pool, priced to 2023 or 2024 expectations, is sitting. Buyers and sellers in Naples are still working out where prices actually are.
The Southwest Florida regional hub report and city-level reports for all five markets are linked in the series index below. The Worthington Realty Naples Housing Market Report for April 2026 covers March 2026 transaction data for the Naples market within Southwest Florida’s five-city corridor. All data draws from the Florida Gulf Coast MLS (FGCMLS via Stellar MLS).
Key Takeaways
- Naples closed sales rose 11.7% year over year to 885, and pending sales rose 13.6% year over year to 1,010. Naples is the only Southwest Florida city with double-digit growth in both metrics simultaneously. Dollar volume crossed $1 billion at $1.042 billion.
- Active listings fell 18.3% year over year to 6,124, but overall MOI of 8.7 months remains the highest in the region. Competitive MOI is 4.7 months, a 4.0-month spread that is the largest in Southwest Florida.
- The Ask-Bid Gap is 16.0%: active listings are asking $387.69 per square foot while March closings landed at $334.14. Median sold PPSF fell 8.9% year over year to $326. Median sale price fell 10.8% year over year to $587,500, partly because a higher share of lower-priced homes closed this month.
- More than one in four Naples active listings is making a second attempt to sell. Relisted homes that eventually sold accepted a median of $17,500 less than their original asking price.
- Median days on market fell from 63 to 60 days year over year, one of only two Southwest Florida cities where DOM improved. Correctly priced listings are closing efficiently.
Naples Closed Sales Rose 11.7% and Dollar Volume Crossed $1 Billion in March 2026
Closed sales tell us what buyers decided weeks ago. Pending sales tell us what they are deciding right now.
Naples recorded 885 closed sales in March 2026, up 11.7% from 792 a year ago, with total dollar volume of $1.042 billion, up 5.5% year over year. More closings at lower average prices. Closed sales grew 11.7% while dollar volume grew a narrower 5.5%. New listings came in at 1,255, down 20.9% from 1,586 a year ago. Active inventory of 6,124 is down 18.3% year over year.
Pending sales at 1,010, up 13.6% from 889 a year ago, are the clearest forward demand signal in the Naples data. The pending-to-active ratio of 23.2% means roughly one in four active Naples listings has an accepted offer. That ratio is rising from approximately 11.9% a year ago (889 pending against 7,492 active), which means roughly twice as many homes are going under contract relative to available inventory as there were a year ago. Showings per listing rose from 3.0 to 3.6 year over year, up 20.0%.
What Is Not Yet Visible in the Active Count
Shadow inventory in Naples (listings that expired, were withdrawn, or were cancelled in the past 12 months without selling and without coming back to market) totals approximately 5,791 addresses, nearly equal to the entire current active count. These are sellers who tested the market, did not find a buyer, and stepped back. This is the largest shadow inventory of any Southwest Florida city in absolute terms and concentrates in the luxury and semi-luxury segments. Whether they come back depends on whether closed sale prices move close enough to what they were hoping to get when they stepped back.
Mortgage Rates as of April 2, 2026
The 30-year fixed-rate mortgage averaged 6.46% as of April 2, 2026, per Freddie Mac’s Primary Mortgage Market Survey, down from 6.64% a year ago but up sharply from around 5.90% in late February. Naples has more cash buyers than any other Southwest Florida city at the luxury tier, so the recent rate rise affects a smaller share of that demand directly. The under-$1M buyer segment, where the 13.6% pending growth is most visible, is more exposed: buyers in that segment who were shopping in February are now facing a rate nearly 50 basis points higher.
Naples Leads the Region with a 16% Ask-Bid Gap and an 8.9% PPSF Decline Year Over Year
Price per square foot normalizes for home size. Median price moves when the mix of homes closing changes, even when underlying values have not.
Naples home values are down about 9% per square foot from a year ago, a real value decline from the 2022-2023 peak, not just a side effect of which homes happened to close this month. The median sale price fell further and tells a slightly different story.
Median sold PPSF fell from $358 to $326 year over year, an 8.9% decline. Median sale price fell from $658,750 to $587,500, a 10.8% decline. The steeper median price drop reflects a mix shift: more lower-priced homes closed this month, pulling the median price down faster than per-square-foot values moved. Both figures declined, and the PPSF decline of 8.9% reflects genuine value adjustment concentrated in the $600,000-$1.5M segment.
Dollar Volume and Sold-to-List Ratio
More transactions, but at lower average prices. Dollar volume reached $1.042 billion, up 5.5% from March 2025’s $987.6 million.
The sold-to-list ratio in Naples is 95.4%, flat from 95.5% a year ago. At contract, buyers are getting within 4.6% of the most recent asking price. The pricing friction is not at the negotiating table. It is in which listings generate interest in the first place.
The 16% Ask-Bid Gap Concentrates at Specific Price Tiers
The Ask-Bid Gap of 16.0%, active listings at $387.69/sf against closings at $334.14/sf, is the widest in Southwest Florida but is not evenly distributed. In Golden Gate Estates and the mid-tier condo market, the spread is narrower and buyer activity is stronger. In the $1M-$3M single-family segment, asking prices are running substantially above where recent sales have landed, and homes in those tiers are sitting longer. Grey Oaks, where limited supply and a defined buyer profile produce consistent high-recovery transactions, is a different market than the broader Naples single-family inventory. The blended 16% figure hides real variation across price tiers that buyers and sellers need to understand before making any decision.
More Than 1 in 4 Naples Active Listings Is Making a Second Attempt to Sell
The Re-list Rate measures what share of current listings have already failed to sell once.
Naples’ Re-list Rate of 27.7% means 1,676 of 6,124 active listings are making a second or later attempt. In absolute numbers, Naples has the most relisted active listings in Southwest Florida, a reflection of market size rather than a disproportionate pricing problem relative to the other cities. As a percentage of active inventory, the 27.7% figure is close to the regional norm.
What Relisting Costs Naples Sellers
Naples relists cost sellers $17,500 relative to their original ask, plus the time and carrying expense of a second listing period.
For homes that eventually sold after relisting, the median original asking price was $702,500 and the median final sale price was $685,000. First-attempt homes that sold closed at a median of $607,500 and 61 days. Relisted homes closed at a higher absolute median ($685,000) than first-attempt homes ($607,500), reflecting the tier composition: relists concentrate in the higher-priced segments where aspirational pricing is most common. The meaningful comparison is the $17,500 reduction from original ask to final sale, plus the carrying cost of a second listing period.
Active relisted listings have accumulated a median of 90 days in their current attempt. The most persistent cases, homes through three or more attempts within 12 months, appear in Naples more than any other Southwest Florida city, concentrated primarily in the $1M-$2.5M single-family segment.
Competitive Supply in Naples Runs 4.1 Months Below the 8.7-Month Overall Figure
Competitive Inventory removes listings that have been sitting unsold for 90-plus days, leaving only the homes a well-priced seller actually competes against.
Naples three-tier months-of-supply breakdown, March 2026:
| Tier | Active Count | MOI |
|---|---|---|
| Overall MOI (all active listings) | 6,124 | 8.7 |
| Stale-stripped MOI (removing listings over 180 days) | 4,862 | 7.2 |
| Competitive MOI (removing listings over 90 days) | 3,211 | 4.7 |
Based on an average of 678.2 closed sales per month over the past 12 months.
What This Means for Correctly Priced Sellers
A correctly priced Naples listing competes against 3,211 properties, not 6,124. The 4.0-month spread between overall and Competitive MOI is the largest in Southwest Florida, reflecting the depth of the stale and relist inventory problem. At 4.7 months of Competitive MOI, correctly priced listings operate in a genuinely balanced market. The friction and the months of accumulating days are concentrated entirely in the listings priced above where recent transactions are landing.
Median days on market fell from 63 to 60 days year over year, one of only two Southwest Florida cities where DOM improved. That improvement confirms what the Competitive MOI tells us: correctly priced Naples listings are moving efficiently. The elevated overall DOM figure elsewhere in the data reflects the persistent stale pool, not the market for accurately priced homes.
Florida Insurance and the Naples Transaction Environment
Naples carries significant insurance complexity across its property types. The city’s coastal luxury inventory faces the most acute cost pressure from flood zone designations, required wind-resistant upgrades, and the difficulty of finding coverage at all for high-value coastal property. Naples also has a meaningful share of older condo buildings in the Park Shore and Moorings corridors that face significant special assessment risk: Florida passed legislation after a 2021 condo collapse in Surfside requiring older buildings to complete structural inspections and fund reserves that many associations had not maintained. Buyers considering older condo buildings should obtain association financials, reserve study data, and current insurance disclosures before contract. Sellers who disclose proactively and accurately typically move listings faster and with fewer contract disruptions.
Core Market Metrics (March 2026 Data)
| City | Median Sold Price | Price/SF | Active Listings | Months of Supply | Sold-to-List | Closed Sales YoY |
|---|---|---|---|---|---|---|
| Fort Myers | $335,000 | $204 | 3,402 | 7.5 | 96.1% | -9.5% |
| Cape Coral | $355,000 | $207 | 2,977 | 6.0 | 97.4% | -14.5% |
| Estero | $467,500 | $246 | 731 | 6.0 | 96.1% | +26.7% |
| Bonita Springs | $580,000 | $309 | 1,172 | 7.8 | 95.1% | +11.4% |
| Naples | $587,500 | $326 | 6,124 | 8.7 | 95.4% | +11.7% |
| SWFL Region | $410,000 | $243 | 20,656 | 7.7 | 96.1% | +2.4% |
Worthington Market Lens (March 2026 Data)
| City | Competitive MOI | Re-list Rate | Ask-Bid Gap | Pending-to-Active | First-Attempt DOM | Relist DOM (current attempt) |
|---|---|---|---|---|---|---|
| Fort Myers | 4.2 | 29.7% | 5.3% | 25.2% | 54 days | 89 days |
| Cape Coral | 3.5 | 26.3% | 15.3% | 29.6% | 54 days | 77 days |
| Estero | 3.6 | 24.9% | 6.1% | 34.9% | 66 days | 76 days |
| Bonita Springs | 4.2 | 28.3% | 13.8% | 28.1% | 61 days | 112 days |
| Naples | 4.7 | 27.7% | 16.0% | 23.2% | 61 days | 90 days |
Source: FGCMLS via Stellar MLS. March 2026 data. Competitive MOI uses active listings under 90 days; average closed sales per month over the past 12 months. Relist DOM reflects current-attempt days only.
Worthington’s Featured Naples Communities
Worthington Realty features six Naples communities with dedicated IDX search pages and monthly tracking. Each needs to be looked at by sub-community before any single number is useful: Bay Colony, the Colony at Pelican Landing, and Esplanade’s large single-family tier are each telling fundamentally different stories than the community-wide numbers suggest.
Lely Resort

- Active Listings: 158
- Sold (Last 120 Days): 79
- Homes Pending: 44
- Pending-to-Active Ratio: 27.8%
- Previously Listed Share of Active: 33.5%
- Months of Inventory: 8.0
- Median Sold Price: $775,000
- Sellers Received: 94.4% of asking price
At 8.0 months of inventory and a 27.8% pending-to-active ratio, Lely Resort is a buyer’s market across most product tiers. The OLE and GreenLinks sub-communities account for 53 of 158 active listings (one-third of available supply) while producing only 13 of 79 closings over the past 120 days, with active DOM running 115 to 133 days. That inventory accumulation is distorting the community-wide metrics. Luxury double-gated sub-communities, including Classics Plantation Estates, Majors, and Lakoya, delivered 28 closings at a $1.25 million median over the same period and are selling more efficiently. Buyers in any tier should use sales from their specific sub-community as their reference: the community-wide median of $775,000 reflects a blend that describes neither the entry-condo tier nor the luxury single-family tier accurately.
Search Lely Resort homes for sale
The Vineyards
- Active Listings: 101
- Sold (Last 120 Days): 54
- Homes Pending: 25
- Pending-to-Active Ratio: 24.8%
- Previously Listed Share of Active: 18.8%
- Months of Inventory: 7.5
- Median Sold Price: $870,000
- Sellers Received: 95.0% of asking price
The active and closed medians at The Vineyards diverge because the two product tiers are selling at fundamentally different rates. The 31 single-family closings in Hammock Isles, Terracina, Tierra Lago, and Valley Oak settled at a $1.175 million median with a 26-day median DOM, the fastest luxury single-family pace among Naples featured communities this cycle. The 23 condo and coach home closings settled at a $675,000 median in 74 days. The active pool’s 101 listings concentrate in the condo and coach home sub-communities with a 103-day median DOM, driving the community-wide active median to $599,900. At 7.5 months of inventory, buyers targeting the condo and coach home tier have substantial selection and no time pressure working against them.
Search The Vineyards homes for sale
Esplanade Golf & Country Club

- Active Listings: 33
- Sold (Last 120 Days): 27
- Homes Pending: 13
- Pending-to-Active Ratio: 39.4%
- Previously Listed Share of Active: 18.2%
- Months of Inventory: 4.9
- Median Sold Price: $1,625,000
- Sellers Received: 96.6% of asking price
With 4.9 months of inventory and a 39.4% pending-to-active ratio, Esplanade carries Naples’ tightest supply balance among featured communities this cycle. The active median list of $799,000 and closed median of $1,625,000 reflect the product-tier divide directly: 18 of 33 active listings are small coach homes and villas priced below $800,000, many sitting for more than 100 days, while 20 of 27 closings were larger 3+den and 4+den single-family homes ranging from $1.45 million to $3.4 million. Golf membership type is the essential due-diligence item here: bundled golf and social-only memberships coexist in the community, and the price and DOM patterns visible in the sub-$800,000 active pool reflect exactly that difference. Sellers in the larger single-family tier are clearing at 96.6% of asking.
Search Esplanade Golf & Country Club homes for sale
Isles of Collier Preserve

- Active Listings: 83
- Sold (Last 120 Days): 44
- Homes Pending: 22
- Pending-to-Active Ratio: 26.5%
- Previously Listed Share of Active: 42.2%
- Months of Inventory: 7.5
- Median Sold Price: $998,500
- Sellers Received: 96.7% of asking price
At 7.5 months of inventory and a 26.5% pending-to-active ratio, Isles of Collier Preserve carries meaningful supply but has reached effective pricing equilibrium: the active median list of $995,000 and closed median of $998,500 are nearly identical. That alignment is the product of significant market correction. The 42.2% relist rate (the highest in Naples) shows that 35 of 83 active listings previously failed to sell and returned after median price reductions of 7.1%. Sellers who priced to market from the start are clearing in 42 days; those cycling back have already absorbed the adjustment cost and are now priced to transact. Buyers can read current list prices as fair market indicators rather than as opening positions.
Search Isles of Collier Preserve homes for sale
Pelican Bay
- Active Listings: 218
- Sold (Last 120 Days): 127
- Homes Pending: 57
- Pending-to-Active Ratio: 26.1%
- Previously Listed Share of Active: 28.0%
- Months of Inventory: 6.9
- Median Sold Price: $1,650,000
- Sellers Received: 93.9% of asking price
Pelican Bay’s community-wide figures require separation by product tier before they are analytically useful. Bay Colony generated 20 of 127 closings over the past 120 days at a $4.8 million median and a 91.7% sold-to-list ratio; the remaining 107 non-Bay Colony closings settled at a $1.399 million median at 94.3% of asking over a 64-day DOM. On the active side, 33 Bay Colony listings at a $4.975 million median are pulling the community-wide active ask to $1.497 million, while 185 standard Pelican Bay listings carry a $1.275 million median. Both tiers show below-full-ask transaction patterns, pointing to active negotiation across the price spectrum. Buyers in either segment should work from tier-specific closed data and ground their offer prices in those sales.
Search Pelican Bay homes for sale
Grey Oaks

- Active Listings: 22
- Sold (Last 120 Days): 15
- Homes Pending: 10
- Pending-to-Active Ratio: 45.5%
- Previously Listed Share of Active: 18.2%
- Months of Inventory: 5.9
- Median Sold Price: $3,950,000
- Sellers Received: 96.4% of asking price
With 15 closings over the past four months, Grey Oaks warrants careful interpretation at the community level. The $16.5 million sale after 788 days and the $9 million Estuary closing after 524 days are both in the data and are not representative signals for most of the active pool. Excluding those two, 13 closings settled between $1.6 million and $7.625 million at a $3.9 million median, with a 94.6% sold-to-list ratio. The sub-community tiers performed distinctly: Estates at Grey Oaks produced 3 closings at a $5.4 million median; Traditions and Terra Verde cleared 4 closings between $1.6 million and $3.95 million in under 50 days each. The 45.5% pending-to-active ratio shows genuine market activity, but buyers evaluating Estuary listings should use Estuary-specific sales as their reference rather than the community median, which spans more than $11 million.
Search Grey Oaks homes for sale
Frequently Asked Questions About the Naples Housing Market
Median sold PPSF fell 8.9% year over year to $326, concentrated in the $600,000-$1.5M segment. From the 2022 peak, values in most Naples segments are down 15-25% per square foot.
Correctly priced listings sold. What remains skews toward 2023-priced listings. The 1,262 listings with 180-plus days on market are anchoring the active asking median above where buyers are transacting. Sellers who price to where recent sales have landed are the ones closing.
Naples offers more selection than anywhere in Southwest Florida, rates below year-ago levels, and sellers accepting 95.4% of asking. Grey Oaks and Esplanade are moving efficiently; Lely and Pelican Bay offer more negotiating room.
Correctly priced first-attempt listings are closing at 61 days. Median days on market fell from 63 to 60 year over year, one of only two cities in the region where DOM improved. Listings past 90 days typically require additional price adjustment.
Naples has the highest supply (8.7 months), the widest Ask-Bid Gap (16%), and the strongest absolute demand: $1 billion in monthly dollar volume with double-digit growth in both pending and closed sales. The most selection, the most negotiating room, the most complexity.
Final Thoughts on the Naples Housing Market
The Naples housing market is the largest and most complex in Southwest Florida, and March 2026 reflects that. Rising demand and tightening supply are real. The Ask-Bid Gap is real too. The sellers who are closing are the ones who accepted that the market cleared 2022 prices two years ago and that the sales data they need to price from is what closed in the past 90 days. The buyers who are finding value are the ones who know that spread well enough to make offers grounded in recent sales.
Search Naples homes for sale | Talk to the Worthington team
Most homeowners feel overwhelmed when it’s time to move. At Worthington Realty, we provide personalized guidance and clear communication so that you feel heard, valued, and confident in your decisions.
April 2026 Southwest Florida Housing Market Report Series
- Southwest Florida Housing Market Report
- Fort Myers Housing Market Report
- Cape Coral Housing Market Report
- Estero Housing Market Report
- Bonita Springs Housing Market Report
- Naples Housing Market Report ← You are here
IDX Searches Fort Myers homes for sale | Cape Coral homes for sale | Estero homes for sale | Bonita Springs homes for sale | Naples homes for sale
All data referenced in Worthington’s market reports draws from the Florida Gulf Coast MLS (FGCMLS via Stellar MLS) unless otherwise noted. Read more about how we calculate these metrics.