

Cape Coral Has the Highest Buyer Activity in Southwest Florida and the Widest Non-Luxury Ask-Bid Gap, and Those Two Facts Define the Market Right Now
Data reflects MLS records as of April 1, 2026. MLS figures may update as late transactions are recorded.
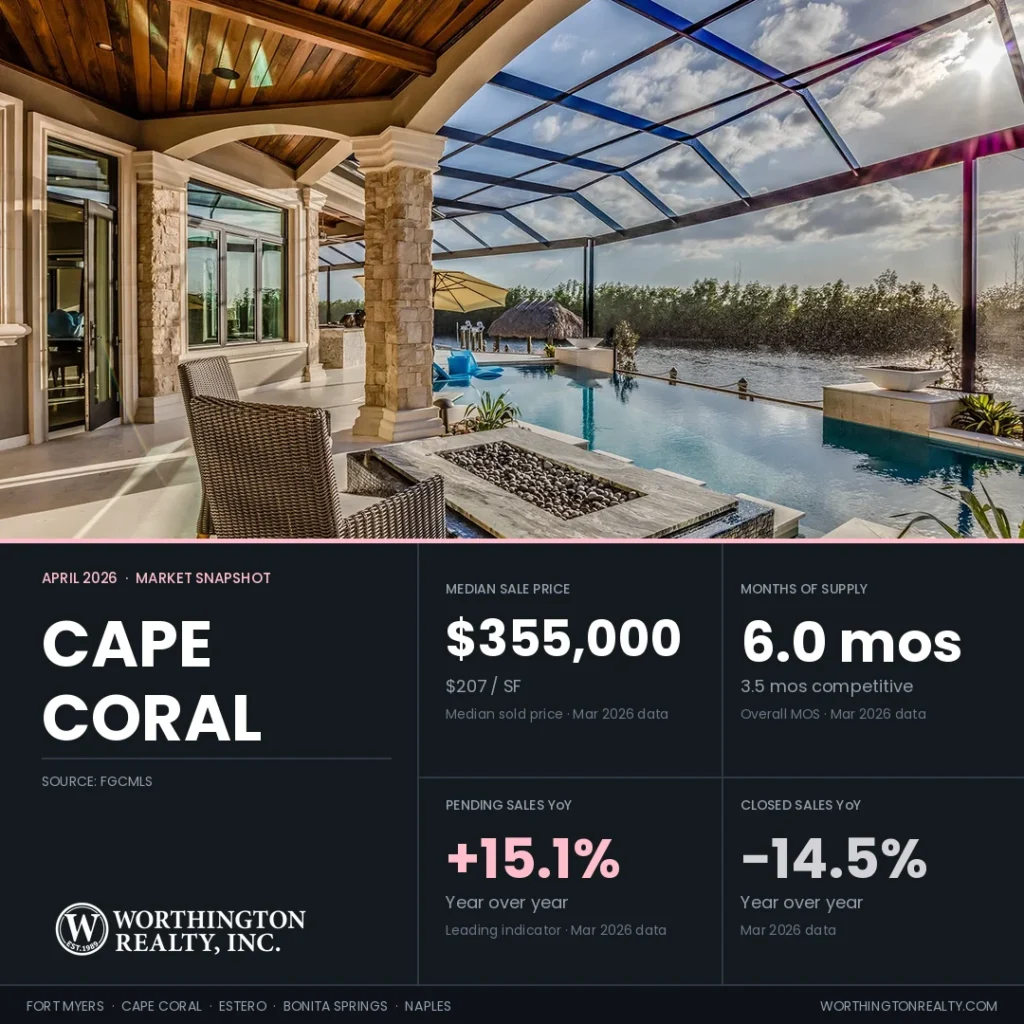
Cape Coral’s March data presents two competing signals: the city recorded the highest showing rate in Southwest Florida at 4.6 per listing and 27.5% fewer homes for sale than a year ago, yet closed sales fell 14.5% and sellers are asking 15.3% more per square foot than where deals are closing. Buyers are actively touring. Sellers are still pricing above where buyers are willing to transact.
The Southwest Florida regional hub report and city-level reports for all five markets are linked in the series index below. The Worthington Realty Cape Coral Housing Market Report for April 2026 covers March 2026 transaction data for the Cape Coral market within Southwest Florida’s five-city corridor. All data draws from the Florida Gulf Coast MLS (FGCMLS via Stellar MLS).
Key Takeaways
- Active listings fell to 2,977, down 27.5% year over year, the largest drop in available homes in Southwest Florida. Closed sales fell 14.5% year over year to 511, but pending sales rose 15.1% year over year — the closed decline reflects the base comparison period, not absent demand.
- Showings per listing reached 4.6, up 24.3% year over year, the highest in the region. Pending sales rose 15.1% year over year to 703 with a pending-to-active ratio of 29.6%.
- The Ask-Bid Gap stands at 15.3%: active listings are asking $244.19 per square foot while March closings landed at $211.74. Relist sellers left a median of $24,000 on the table, the largest relist dollar penalty in Southwest Florida.
- Median sold PPSF fell 5.5% year over year to $207. Median sale price fell 3.9% year over year to $355,000.
- Competitive MOI is 3.5 months against an overall MOI of 6.0, meaning a correctly priced Cape Coral listing competes against roughly 1,682 properties, not 2,977.
Cape Coral Leads the Region in Showings at 4.6 Per Listing While Closed Sales Are Still Falling
Closed sales tell us what buyers decided weeks ago. Pending sales tell us what they are deciding right now.
Cape Coral recorded 511 closed sales in March 2026, down 14.5% from 598 a year ago, with total dollar volume of $230.2 million, down 18.4% year over year. Both the count and the average transaction price fell. Dollar volume declined more steeply than either figure would indicate on its own. New listings came in at 787, down 19.8% from 981 a year ago. Active inventory of 2,977 is down 27.5% year over year, the steepest drop in available homes of any city in the region.
The pending count of 703, up 15.1% year over year, is the clearest evidence of where buyer engagement stands. With a showing rate of 4.6 per listing, the highest in Southwest Florida and up from 3.7 a year ago, buyers are not just browsing Cape Coral inventory. They are touring it actively. The pending-to-active ratio of 29.6% means nearly one in three active listings has an accepted offer. The gap between strong pending activity and lower closed sales reflects the same timing dynamic: pending sales are a leading indicator of current buyer decisions, while closed sales reflect what buyers decided 30 to 60 days ago against a strong March 2025 base. The pending growth is the more useful signal — buyer engagement in Cape Coral is genuinely rising.
What Is Not Yet Visible in the Active Count
Shadow inventory in Cape Coral — listings that expired, were withdrawn, or were cancelled in the past 12 months without selling and without coming back to market — totals approximately 4,043, about 35% more than the 2,977 homes currently active. These owners tried, did not find a buyer, and have not relisted. They could come back if seller conditions improve.
Mortgage Rates as of April 2, 2026
The 30-year fixed-rate mortgage averaged 6.46% as of April 2, 2026, per Freddie Mac’s Primary Mortgage Market Survey, down from 6.64% a year ago but up from around 5.90% in late February — rates have risen more than 50 basis points in six weeks. Cape Coral’s buyer pool includes a large share of financed buyers at the price points that drive most of the city’s sales. The year-over-year comparison is still favorable, but buyers financing today are locking at a meaningfully higher rate than those who moved in February.
Cape Coral PPSF Fell 5.5% Year Over Year and the Ask-Bid Gap Sits at 15.3%
Price per square foot normalizes for home size. Median price moves when the mix of homes closing changes, even when underlying values have not.
Cape Coral’s median sold PPSF fell from $219 to $207 year over year, a 5.5% decline. Median sale price fell from $369,495 to $355,000, a 3.9% decline. Both figures moving in the same direction with similar magnitude suggests this is a real value decline — not a side effect of a different mix of homes closing this month. The sold-to-list ratio of 97.4% is the highest in the region and flat from a year ago. At contract, buyers are getting within 2.6% of the most recent asking price.
The Average Active Listing in Cape Coral Is Priced 15% Above Where Recent Closings Landed
That is the defining number in this market right now. The Ask-Bid Gap of 15.3% measures the spread between median active asking PPSF ($244.19) and median sold PPSF ($211.74) from recent closings. It does not mean every listing is 15% overpriced. It means the pool of active listings, as a group, is priced 15% above where the pool of recently closed transactions landed. The spread concentrates in the city’s aging inventory: listings that entered 12 or more months ago at peak prices and have not reduced to match where recent sales are landing. Entry-level listings under $300,000 carry a much narrower spread. The reading widens considerably in the $450,000-$800,000 tier, particularly for canal-front and gulf-access homes.
Approximately 19.4% of Cape Coral’s active listings have been on market for 180 days or more. Those 571 listings anchor the active asking median upward, widening the apparent Ask-Bid figure even for correctly priced listings entering at current values.
Cape Coral Relist Sellers Left $24,000 on the Table, the Largest Penalty in Southwest Florida
The Re-list Rate measures what share of current listings have already failed to sell once. It is a behavioral signal telling us how sellers are responding to current conditions.
Cape Coral’s Re-list Rate of 26.3% means 773 of 2,940 active listings are making a second or later attempt. Relisted homes in Cape Coral carry a median of 77 days in their current listing attempt, already a substantial period in the second try, before accounting for whatever time accumulated in the first.
What Relisting Costs Cape Coral Sellers
Cape Coral’s relist penalty is the largest in Southwest Florida: sellers who needed a second attempt accepted $24,000 less than their original asking price.
For homes that eventually sold after relisting, the median original asking price was $449,000 and the median final sale price was $425,000. That $24,000 gap is what sellers left on the table relative to their initial price, before factoring in the carrying costs of two listing periods. First-attempt homes that sold closed at a median of $351,000 in 54 days.
The higher median for relist closings ($425,000 vs. $351,000) is a price-point pattern, not a coincidence. Relists in Cape Coral concentrate in the canal-front and gulf-access segment, where homes are more expensive. The dollar penalty has nothing to do with price level. It comes down to how far the original asking price was from what buyers were actually willing to pay.
Stubborn relists — homes that came back at less than 3% below their prior asking price — account for approximately 20% of Cape Coral’s relisted active listings. These sellers are trying again at essentially the same price that buyers already passed on.
At 3.5 Months of Competitive Supply, Cape Coral Has the Tightest Effective Market Outside Estero
Competitive Inventory removes listings that have been sitting unsold for 90-plus days, leaving only the homes a well-priced seller actually competes against.
Cape Coral three-tier months-of-supply breakdown, March 2026:
| Tier | Active Count | MOI |
|---|---|---|
| Overall MOI (all active listings) | 2,977 | 6.0 |
| Stale-stripped MOI (removing listings over 180 days) | 2,406 | 5.1 |
| Competitive MOI (removing listings over 90 days) | 1,682 | 3.5 |
Based on an average of 474.1 closed sales per month over the past 12 months.
What This Means for Correctly Priced Sellers
A correctly priced Cape Coral listing competes against 1,682 properties, not 2,977. The 1,295-listing difference is stale inventory and persistent relists that buyers have already evaluated and rejected. That narrower competitive pool explains why correctly priced Cape Coral listings are seeing 4.6 showings and closing in 54 days despite the city’s headline supply figures. The friction is not missing demand. It is the share of the active pool that has not priced to market.
Florida Insurance and the Cape Coral Transaction Environment
Cape Coral’s waterfront inventory carries the most significant insurance exposure in Southwest Florida. Many canal-front properties are in federally designated flood zones where the government recently overhauled how flood insurance premiums are calculated — moving from a flat-rate model to one based on each property’s individual flood risk. For many waterfront homeowners, that change produced substantially higher annual premiums. Buyers who did not factor flood insurance into their initial budgets often encounter costs during due diligence that alter their decision. Sellers of waterfront properties who obtain current flood insurance quotes before listing and provide them proactively reduce the probability of mid-contract surprises and the contract cancellations that follow.
Core Market Metrics (March 2026 Data)
| City | Median Sold Price | Price/SF | Active Listings | Months of Supply | Sold-to-List | Closed Sales YoY |
|---|---|---|---|---|---|---|
| Fort Myers | $335,000 | $204 | 3,402 | 7.5 | 96.1% | -9.5% |
| Cape Coral | $355,000 | $207 | 2,977 | 6.0 | 97.4% | -14.5% |
| Estero | $467,500 | $246 | 731 | 6.0 | 96.1% | +26.7% |
| Bonita Springs | $580,000 | $309 | 1,172 | 7.8 | 95.1% | +11.4% |
| Naples | $587,500 | $326 | 6,124 | 8.7 | 95.4% | +11.7% |
| SWFL Region | $410,000 | $243 | 20,656 | 7.7 | 96.1% | +2.4% |
Worthington Market Lens (March 2026 Data)
| City | Competitive MOI | Re-list Rate | Ask-Bid Gap | Pending-to-Active | First-Attempt DOM | Relist DOM (current attempt) |
|---|---|---|---|---|---|---|
| Fort Myers | 4.2 | 29.7% | 5.3% | 25.2% | 54 days | 89 days |
| Cape Coral | 3.5 | 26.3% | 15.3% | 29.6% | 54 days | 77 days |
| Estero | 3.6 | 24.9% | 6.1% | 34.9% | 66 days | 76 days |
| Bonita Springs | 4.2 | 28.3% | 13.8% | 28.1% | 61 days | 112 days |
| Naples | 4.7 | 27.7% | 16.0% | 23.2% | 61 days | 90 days |
Source: FGCMLS via Stellar MLS. March 2026 data. Competitive MOI uses active listings under 90 days; average closed sales per month over the past 12 months. Relist DOM reflects current-attempt days only.
Worthington’s Featured Cape Coral Communities
Worthington Realty features five Cape Coral communities with dedicated IDX search pages and monthly tracking. This cycle they split between the entry-tier single-family market at Sandoval, where demand is steady, and the waterfront luxury communities, where half or more of active listings have already failed at a prior price.
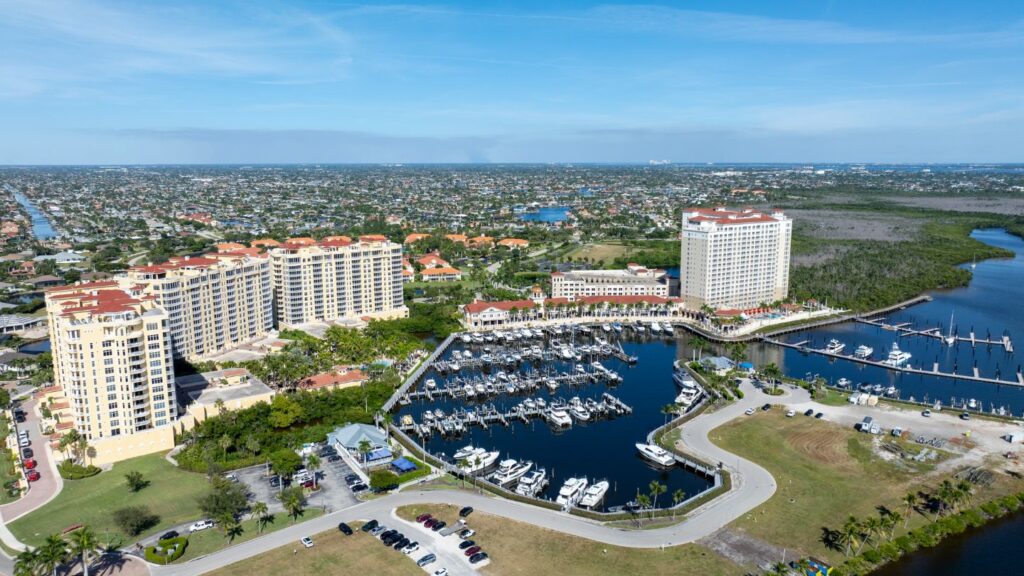
Cape Harbour
- Active Listings: 34
- Sold (Last 120 Days): 15
- Homes Pending: 7
- Pending-to-Active Ratio: 20.6%
- Previously Listed Share of Active: 29.4%
- Months of Inventory: 9.1
- Median Sold Price: $1,150,000
- Sellers Received: 91.3% of asking price
At 9.1 months of inventory and a 20.6% pending-to-active ratio, Cape Harbour is carrying the softest supply-demand balance among Cape Coral’s featured communities. The median sold price of $1,150,000 reflects a 120-day period when several large custom estate closings on Shell Cove Drive, Harbour Circle, and El Dorado Parkway pulled the community figure well above where the active pool concentrates. The 28 current Cape Harbour sub-community listings — weighted toward condos on Cape Harbour Drive — have a median ask of $577,000. Sellers have averaged 91.3% of asking, and returning sellers have cut prices a median 11.8% from their prior attempt. Buyers who have identified their specific product have documented room to negotiate from the cleared range in either tier.
Search Cape Harbour homes for sale
Cape Royal
- Active Listings: 16
- Sold (Last 120 Days): 7
- Homes Pending: 5
- Pending-to-Active Ratio: 31.2%
- Previously Listed Share of Active: 37.5%
- Months of Inventory: 9.1
- Median Sold Price: $589,000
- Sellers Received: 96.3% of asking price
With only 7 closed sales over the past four months, any single transaction can move Cape Royal’s median — comparable sales within your specific home type and street are a more reliable guide than the community figure. What the data does show clearly is a pricing mismatch: all 7 closings landed between $525,000 and $705,000, while 11 of the 16 current active listings are priced above $700,000, producing an active median list of $861,450 and a median DOM of 132 days. Royal Tee Country Club Estates closed at a $647,000 median on 2 sales; Cape Royal proper closed at a $585,000 median on 5 sales. A relist rate of 37.5% confirms that sellers testing prices well above the cleared range are cycling off unsold. Buyers have a precise picture of where the market is actually transacting.
Search Cape Royal homes for sale
Sandoval
- Active Listings: 34
- Sold (Last 120 Days): 31
- Homes Pending: 14
- Pending-to-Active Ratio: 41.2%
- Previously Listed Share of Active: 17.6%
- Months of Inventory: 4.4
- Median Sold Price: $365,000
- Sellers Received: 95.4% of asking price
Sandoval’s 41.2% pending-to-active ratio and 4.4 months of inventory make it the most active of Cape Coral’s featured communities — demand is steady and supply is not excessive. The product tiers are telling separate stories. Carriage homes in Somerville closed at a $244,500 median over the past 120 days; single-family homes across the remaining sub-communities closed at a $408,000 median. The active pool currently has 13 listings priced above $500,000, a tier where only 5 of the past 31 closings reached. Sellers pricing single-family homes above $500,000 should expect extended market time — the cleared range is centered well below that threshold, and the 84-day median DOM reflects the patience required here even at market-appropriate prices.
Search Sandoval homes for sale
Tarpon Point
- Active Listings: 17
- Sold (Last 120 Days): 10
- Homes Pending: 1
- Pending-to-Active Ratio: 5.9%
- Previously Listed Share of Active: 47.1%
- Months of Inventory: 6.8
- Median Sold Price: $911,000
- Sellers Received: 96.2% of asking price
A pending-to-active ratio of 5.9% — one contract on 17 active listings — is the most striking signal at Tarpon Point right now. Two December penthouse closings at Silver King Boulevard (units 1203 and 1204 at $2,650,000 and $3,200,000) represent the top tier of Tarpon Landings and draw the community median upward; the remaining 8 closings settled between $590,000 and $1,100,000 at a median of $809,000. A relist share of 47.1% with a median price reduction of 11.1% confirms that nearly half the active pool has already failed at a prior price. Tarpon Landings active listings are sitting a median of 148 days while sold homes turned in 48. Sellers who want to move in this cycle need to price at the $809,000 tier’s cleared range — not against the December penthouse transactions, which are not a useful reference point for most of the active inventory.
Search Tarpon Point homes for sale
Cape Coral Yacht Club
- Active Listings: 19
- Sold (Last 120 Days): 9
- Homes Pending: 7
- Pending-to-Active Ratio: 36.8%
- Previously Listed Share of Active: 52.6%
- Months of Inventory: 8.4
- Median Sold Price: $800,000
- Sellers Received: 92.7% of asking price
With 9 closings over the past four months, Cape Coral Yacht Club’s transaction volume remains thin enough that a single large sale moves the community figures significantly — a $3,300,000 waterfront estate on Coral Drive in January is doing exactly that. Excluding that sale, the remaining 8 closings produced a median closer to $700,000. More than half the active listings previously failed to sell at a prior asking price, with returning sellers reducing a median 6.1% from their previous attempt, and sellers are still averaging 92.7% of asking at closing even after those reductions. That combination — a 52.6% relist rate and a 92.7% sold-to-list ratio — gives buyers a consistent signal. Address-level comparable research is essential in a community where the range runs from $292,000 to $3,300,000 in a single 120-day window.
Search Cape Coral Yacht Club homes for sale
Frequently Asked Questions About the Cape Coral Housing Market
The listings that sold last year were correctly priced. What remains skews toward listings that haven’t repriced since 2023. The $24,000 relist dollar penalty shows the practical cost of waiting.
Falling closed sales reflect the base comparison — March 2025 was exceptionally strong, and closed sales measure contracts that formed 30 to 60 days earlier. The pending growth is the current signal.
At 3.5 months of Competitive MOI, correctly priced listings are generating 4.6 showings and closing in 54 days. Buyers have negotiating room on listings over 90 days old. Sellers who price to where recent sales have landed are moving inventory.
Median days on market fell from 60 to 54 days year over year — the only city in Southwest Florida where DOM improved. Relisted homes are accumulating 77 days in their current attempt without going under contract.
Sandoval leads with 4.4 months of inventory, a 41.2% pending-to-active ratio, and the lowest relist rate in the group. The $365,000 median entry tier is where the most consistent demand is concentrated right now.
Final Thoughts on the Cape Coral Housing Market
The Cape Coral housing market in March 2026 gives buyers a clear signal: the city with the most active showing behavior in Southwest Florida also carries the widest Ask-Bid Gap of any non-luxury market. Buyers who use the closed comp data, not the active asking prices, as their pricing reference are the ones positioning offers that lead to contracts. For sellers, correctly priced listings are closing faster than a year ago. The ones accumulating days are priced to a market that closed in 2023.
Search Cape Coral homes for sale | Talk to the Worthington team
Most homeowners feel overwhelmed when it’s time to move. At Worthington Realty, we provide personalized guidance and clear communication so that you feel heard, valued, and confident in your decisions.
April 2026 Southwest Florida Housing Market Report Series
- Southwest Florida Housing Market Report
- Fort Myers Housing Market Report
- Cape Coral Housing Market Report ← You are here
- Estero Housing Market Report
- Bonita Springs Housing Market Report
- Naples Housing Market Report
IDX Searches Fort Myers homes for sale | Cape Coral homes for sale | Estero homes for sale | Bonita Springs homes for sale | Naples homes for sale
All data referenced in Worthington’s market reports draws from the Florida Gulf Coast MLS (FGCMLS via Stellar MLS) unless otherwise noted. Read more about how we calculate these metrics.