
Buyer Activity Is Rising, Inventory Is Contracting, and Pricing Discipline Is Determining Outcomes
January 2026 marks a measurable shift in the Southwest Florida real estate market. Leading indicators have now improved year over year for nine consecutive months following nearly two years of inventory buildup and price adjustment. Contract activity accelerated again in January, buyer engagement increased, and new listing activity declined. Prices remain under pressure and buyers retain leverage, but market conditions are no longer behaving the way they did throughout 2024 and early 2025.
Perhaps the clearest signal is seller behavior. Across many of the region’s most active communities, a significant share of current listings previously failed to sell. When those homes returned to the market, most did so at lower prices. That pattern suggests the market is actively correcting expectations.
Key Takeaways (TL;DR)
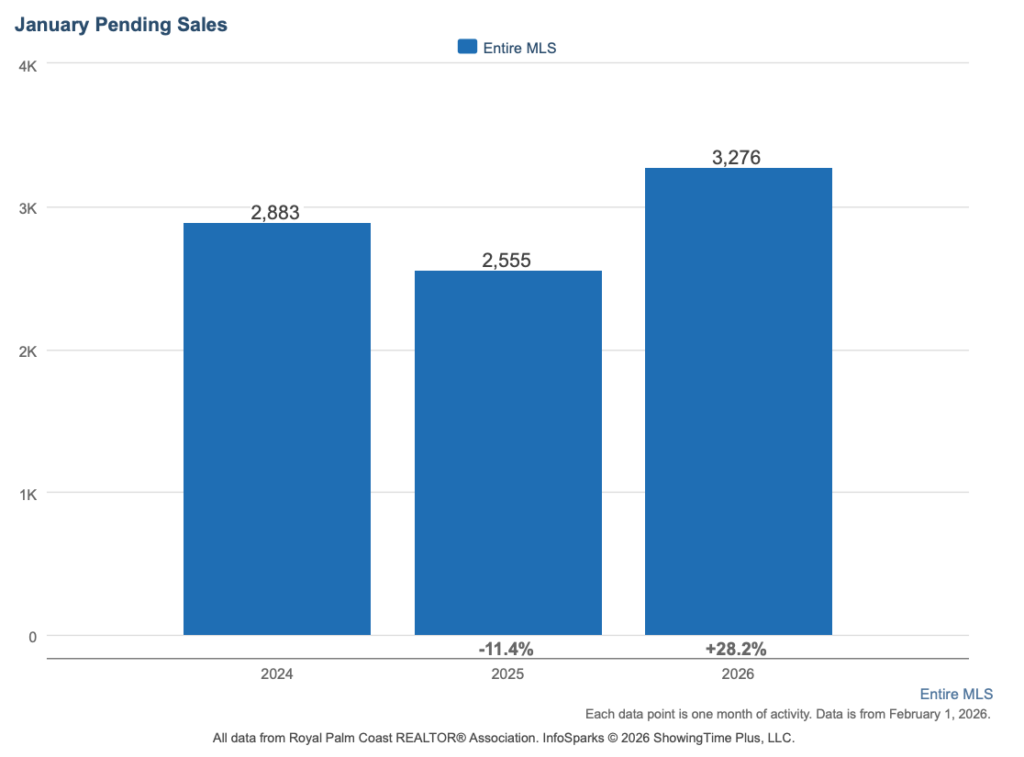
- Buyer activity is improving. Pending sales rose 28.2% year over year to 3,276 contracts, while showings per listing increased 16.7% region-wide.
- Inventory pressure is easing, but not quite gone. New listings declined 21%, active inventory fell 13%, and months of supply improved to 8.1.
- Prices are normalizing from peak levels. The regional median is down 4.6% year over year but remains more than 30% above January 2021.
- Seller behavior has shifted. Roughly one-third of active listings represent sellers returning after a failed attempt, most with price reductions.
- Pricing accuracy still determines outcomes. Overpriced homes took 26–68% longer to sell depending on market.
Southwest Florida Market Snapshot (Context, Not the Whole Story)
| Market | Median Price | YoY Δ | Closed | Closed YoY Δ | Pending | Pending YoY Δ | Months Supply | Median DOM |
| Fort Myers | $350,000 | -7.9% | 306 | -1.3% | 588 | +29.5% | 7.7 | 43 |
| Cape Coral | $352,450 | -3.4% | 322 | +6.3% | 595 | +39.7% | 6.4 | 45 |
| Estero | $530,000 | -13.1% | 95 | +3.3% | 160 | +23.1% | 6.9 | 52 |
| Bonita Springs | $567,500 | +0.4% | 120 | +10.1% | 233 | +33.9% | 8.4 | 47 |
| Naples | $651,000 | -3.6% | 510 | -5.7% | 885 | +22.6% | 8.9 | 59 |
| SWFL Region | $419,950 | -4.6% | 1,852 | 0.0% | 3,276 | +28.2% | 8.1 | 53 |
These numbers do a good job of framing the conversation, but they don’t explain behavior. That comes from how supply and demand are interacting beneath the surface.
Southwest Florida Real Estate Market: Supply and Demand
Inventory is finally moving in the right direction, but not because homes are flying off the shelf.
Active listings declined 13% year over year, marking the first sustained pullback since the post-pandemic surge. That decline is being driven primarily by fewer new sellers entering the market, not by dramatically faster sales. New listings fell 21% across the region, signaling that homeowners who do not need to sell are choosing to wait.
At the same time, buyer engagement is strengthening. Pending sales jumped more than 28% year over year, meaning contracts signed in January will flow into closings over the next several months. Showings per listing rose nearly 17% region-wide.
This shift is especially visible for buyers searching for homes for sale in Cape Coral, where showing activity rose more than 45% year over year. Interest also improved meaningfully among buyers evaluating Naples real estate listings and Bonita Springs homes for sale, though at a slower pace.
The result is a market that still favors buyers, but not by the margin we saw last year.
Reading the Momentum: What the Pipeline Is Telling Us
Rather than focusing only on closed sales, the most useful forward indicator right now is the relationship between pending contracts and completed transactions.
Across Southwest Florida, there are roughly 1.8 pending sales for every closed sale. That ratio signals a growing pipeline and points to higher closing volume in February and March if contracts hold.
Cape Coral and Fort Myers currently show the strongest pipeline expansion, while Naples and Estero reflect steadier but still positive momentum. This pattern suggests the SWFL housing market is stabilizing unevenly, with more affordable segments responding first.
Pricing trends in the Southwest Florida Real Estate Market
Price headlines often lack context. While the regional median declined 4.6% year over year, that figure masks how far prices remain above pre-pandemic levels.
Even after recent corrections, the typical Southwest Florida home for sale is still more than 30% more expensive than in January 2021. What has changed is not long-term value, but short-term expectations set during the 2021–2022 surge.
Among Naples luxury homes, prices have held closest to peak levels, currently down less than 4% from the high. By contrast, buyers comparing Cape Coral homes have seen prices adjust nearly 20% from peak, reflecting greater sensitivity to affordability and inventory levels.
Price-per-square-foot data reinforces this pattern. Bonita Springs is the only major market showing year-over-year appreciation on a per-square-foot basis, while Estero experienced the most meaningful softening.
The Pricing Accuracy Effect (Why Strategy Matters More Than Timing)
One of the clearest lessons from January’s 1,375 closed transactions is how strongly pricing discipline affects outcomes.
Homes that sold at 96% or more of list price moved significantly faster than those that required reductions. The penalty for overpricing was most pronounced for sellers in Bonita Springs and Naples, where inflated initial pricing extended timelines by more than 50%.
In practical terms, aspirational pricing does not simply delay a sale, it often results in longer market time, higher carrying costs, and a lower final price once adjustments are made.
The healthiest activity continues to occur between $250,000 and $600,000, which accounted for nearly half of all January closings and posted the strongest sale-to-list ratios.
What the Re-List Data Reveals About Seller Behavior
Aggregate market statistics describe overall conditions. Seller behavior shows how those conditions are being absorbed at the community level.
Across nearly 30 of Worthington Realty’s featured communities, approximately one-third of current active listings represent sellers returning to the market after a previous attempt. In most cases, those sellers adjusted their approach when re-entering the market: 81% returned with price reductions averaging 6.5%.
What stands out is the way pricing adjustments vary by community.
In communities such as Tarpon Point and Cape Coral Yacht Club, higher re-list rates indicate that many sellers initially entered the market above the price levels buyers were responding to at the time. When those homes returned, pricing was typically brought closer to recent closing activity, often after extended exposure during the first listing period.
Other communities show a different pattern. In places like Verdana Village and Timber Creek, fewer listings required a second attempt, and re-listed homes tended to re-enter the market aligned with current sales benchmarks. These communities have experienced steadier absorption and more predictable selling timelines, even within a slower regional environment.
Taken together, the data shows that pricing behavior is being resolved locally, at the community level. Sellers who align quickly with current market signals tend to move forward with fewer listing cycles, while those adjustments made later extend the overall selling timeline.
What Southwest Florida Homeowners Are Asking
It’s a buyer’s market, but narrowing. Inventory sits at 8.1 months of supply, well above balanced levels, and most homes sell at 95-96% of list price. However, pending sales jumped 28% year over year—buyers still have leverage, but not for long.
Softening, not falling sharply. The regional median declined 4.6% from last January but remains 31% above January 2021. Current trends point toward stabilization. Further significant declines would require a demand shock or distressed inventory surge—neither is evident.
Likely pricing. Across our featured communities, one-third of active listings previously failed to sell. When those sellers returned, 81% came back with price cuts averaging 6.5%. Overpriced homes sat 26-68% longer than well-priced competition. The market provides feedback—pricing determines whether you hear it early or late.
Depends on pricing. Well-priced homes move in 37-52 days. Overpriced listings take 20-40% longer. The fastest activity is in the $250K-$600K range, where demand and sale-to-list ratios are strongest.
Cape Coral shows the strongest demand recovery—showings up 45%, pending sales up 37%. Bonita Springs shows the best price stability. At the community level, Verdana Village and Timber Creek demonstrate that realistic pricing still works even in a slower market.
Final Thoughts
January data shows a market in transition. Demand is improving, inventory is easing, and seller expectations are adjusting. The SWFL real estate environment now rewards strategy more than timing and realism more than optimism.
For buyers, conditions remain favorable, but competition is returning as we see in the increase in Pending Sales. For sellers, the message is clear: study what is actually closing in your community and price accordingly.
Ready to explore your options? Search Southwest Florida homes or contact our team to discuss what these trends mean for your specific neighborhood, property type, and timeline.
Most homeowners feel overwhelmed when it’s time to move. At Worthington Realty, we provide personalized guidance and clear communication so that you feel heard, valued, and confident in your decisions.
Methodology: This analysis draws from three data sources within the Florida Gulf Coast MLS, including monthly aggregate statistics from InfoSparks covering January 2021 through January 2026, detailed transaction data from 1,375 residential sales that closed in January 2026, and a featured communities review of 1,516 active listings, of which 501 were identified as re-listed properties through address matching against terminated, expired, and withdrawn listings from the prior 12 months. All data reflects residential properties recorded in the MLS during the stated periods.