

Estero’s smaller transaction volume can exaggerate month-to-month swings, which is why broader trends matter more than the headlines.
January 2026 data from the Florida Gulf Coast MLS reflects an Estero real estate market where buyer activity is increasing, even as price signals require careful interpretation. With roughly 95 closed sales per month compared to 300 or more in neighboring cities, Estero experiences greater month-to-month volatility in median pricing.
The headline figure, a 13.1% year-over-year decline in median price, overstates the underlying adjustment. January 2025 recorded the highest median price in Estero’s recent history at $610,000, driven by a small and unusually high-end sample. When pricing is viewed through trailing averages and activity metrics, the market appears more stable and more consistent with broader Southwest Florida trends.
What the data shows more clearly is demand. Buyers are showing up, sellers are listing fewer homes, and inventory conditions are tightening from last year’s peak.
Key Takeaways (TL;DR)
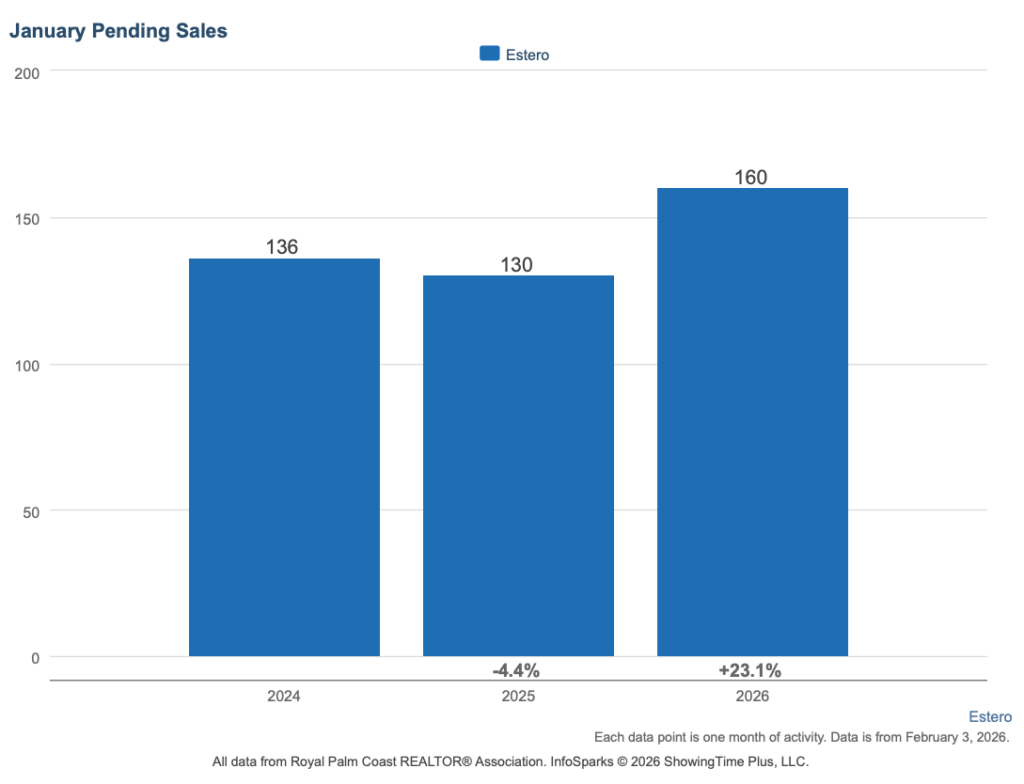
- Buyer activity is increasing. Pending sales rose 23.1% year over year to 160, and showings per listing increased 25.8%.
- Inventory is tightening. Months of supply improved from 8.6 to 6.9, placing Estero among the tighter supply levels in Southwest Florida.
- The price headline is exaggerated. The 13.1% year-over-year decline reflects an unusually high January 2025 baseline. Trailing six-month averages show a decline closer to 6.9%.
- Closed sales remain stable. Estero recorded 95 closings in January, up 3.3% year over year.
- Pricing accuracy varies by community. Re-list rates in featured Estero communities range from 17% to 48%, with timelines diverging sharply based on initial pricing strategy.
Estero Compared to Southwest Florida
The table below places the Estero housing market in the context of surrounding Southwest Florida markets.
| Market | Median Price | YoY Change | Closed | Closed YoY | Pending | Pending YoY | Months Supply | Median DOM |
|---|---|---|---|---|---|---|---|---|
| Fort Myers | $350,000 | -7.9% | 306 | -1.3% | 588 | +29.5% | 7.7 | 43 |
| Cape Coral | $352,450 | -3.4% | 322 | +6.3% | 595 | +39.7% | 6.4 | 45 |
| Estero | $530,000 | -13.1% | 95 | +3.3% | 160 | +23.1% | 6.9 | 52 |
| Bonita Springs | $567,500 | +0.4% | 120 | +10.1% | 233 | +33.9% | 8.4 | 47 |
| Naples | $651,000 | -3.6% | 510 | -5.7% | 885 | +22.6% | 8.9 | 59 |
| SWFL Region | $419,950 | -4.6% | 1,852 | 0.0% | 3,276 | +28.2% | 8.1 | 53 |
Estero’s year-over-year price decline stands out in this comparison, but context matters. With fewer monthly transactions, Estero’s median price is more sensitive to the mix of homes that close in any given month. Activity indicators such as pending sales, showings, and months of supply provide a more consistent view of market direction.
For a deeper look at regional trends shaping local markets, see our Southwest Florida Real Estate Market Report – February 2026. To see how this local trend fits into the broader statewide picture, read Florida Housing Ends 2025 Stronger Than Expected (Florida Realtors).
Estero Market Snapshot
- Median Sale Price: $530,000
- Year-over-Year Price Change: -13.1% headline, approximately -6.9% using trailing six-month averages
- Closed Sales: 95, up 3.3% year over year
- Pending Sales: 160, up 23.1% year over year
- Months of Supply: 6.9
- Median Days on Market: 52 days
Buyer activity in Estero has increased, even as homes are taking longer to sell than during peak years. Longer timelines reflect more deliberate decision-making rather than lack of interest. Buyers searching for homes for sale in Estero are finding more time to compare options, while well-priced listings continue to draw attention.
Supply and Demand in the Estero Housing Market
Inventory conditions in Estero have tightened meaningfully over the past year. Months of supply declined from 8.6 to 6.9, while active listings fell 8.0% year over year. New listings declined 30.7%, the sharpest pullback among major Southwest Florida markets.
At the same time, buyer engagement increased. Pending sales rose 23.1% year over year, and showings per listing climbed 25.8%. This combination, rising demand meeting reduced new supply, is gradually shifting leverage toward sellers who price realistically.
Pricing Trends and Why the Headline Decline Overstates the Shift
The 13.1% year-over-year price decline in Estero requires context.
January 2025 recorded a $610,000 median price, the highest in recent history, driven by a small sample of higher-end sales. Comparing January 2026 to that outlier exaggerates the apparent correction.
Trailing six-month averages show prices down approximately 6.9% year over year. The full-year 2025 average declined 6.3% from 2024. Both measures point to a meaningful adjustment rather than a collapse.
Even after this recalibration, Estero home prices remain roughly 47% above January 2021 levels.
Why Pricing Accuracy Continues to Determine Outcomes
Improving demand has not eliminated the importance of pricing discipline.
With roughly 95 monthly closings, pricing errors carry more weight in Estero than in higher-volume markets. Homes priced above recent comparable sales face longer timelines, even as buyer activity improves.
Community-level data shows this clearly.
Estero Featured Communities
Verdana Village

• Recent Activity: 51 sales in the past 120 days
• Pricing: Median sold $550,000 | Range $316,667–$1,331,232
• Home Types: Single-family homes in a newer master-planned community
• Market Snapshot: 2.6 months of supply | 33 active listings | 4 pending
Verdana Village posted the highest sales volume among Estero featured communities, with activity split between new construction and resale. Builder sales (22 transactions) closed at full asking price, while resale transactions (29) showed typical negotiation at 95.4% sale-to-list with a 57-day median DOM. Among current resale listings, 24% previously came off market and returned, a relatively modest share compared to other communities in the region.
Search homes for sale in Verdana Village to see how current pricing compares to recent sales.
Bella Terra

• Recent Activity: 31 sales in the past 120 days
• Pricing: Median sold $497,500 | Range $245,000–$800,000
• Home Types: Villas and single-family homes
• Market Snapshot: 3.7 months of supply | 72-day median DOM | 97.5% sale-to-list
Bella Terra continues to show solid turnover with 3.7 months of supply. The re-list rate of 48%, the highest among Estero featured communities, indicates many sellers are adjusting pricing after initial attempts. Notably, re-listed homes are moving faster than fresh listings (61 vs 80 days), reinforcing the impact of pricing adjustments.
Explore homes for sale in Bella Terra to compare active listings with recent closed prices.
Cascades at Estero
• Recent Activity: 8 sales in the past 120 days
• Pricing: Median sold $410,000 | Range $305,000–$480,000
• Home Types: Single-family homes in an active adult community
• Market Snapshot: 5.5 months of supply | 22-day median DOM | 96.8% sale-to-list
Cascades at Estero is a smaller community with lower transaction volume, so individual sales carry more weight in the data. The 22-day median DOM is the fastest among Estero featured communities, and only 18% of active listings previously came off market and returned, the lowest re-list rate in the group. Strong pending activity continues to support buyer engagement.
View homes for sale in Cascades at Estero to understand current inventory and pricing.
Stoneybrook
• Recent Activity: 13 sales in the past 120 days
• Pricing: Median sold $429,000 | Range $257,000–$650,000
• Home Types: Villas, condos, and single-family homes in a golf course community
• Market Snapshot: 5.5 months of supply | 36-day median DOM | 96.2% sale-to-list
Stoneybrook shows consistent activity with 5.5 months of supply and a 36-day median DOM. Among active listings, only 17% previously came off market and returned, suggesting sellers are generally pricing in line with market expectations on initial listing. Negotiation remains modest and consistent with broader Estero trends.
Search homes for sale in Stoneybrook to explore current golf community inventory.
The Place at Corkscrew
• Recent Activity: 29 sales in the past 120 days
• Pricing: Median sold $700,000 | Range $455,000–$1,300,000
• Home Types: Single-family homes in a newer master-planned community
• Market Snapshot: 6.2 months of supply | 74-day median DOM | 95.9% sale-to-list
The Place at Corkscrew continues to attract buyers in the upper-middle price range, supported by solid transaction volume. About 31% of active listings previously came off market and returned, and those re-listed homes are taking longer to sell than fresh listings (90 vs 62 days), reinforcing the importance of early pricing alignment.
Explore homes for sale in The Place at Corkscrew to compare current inventory with recent sales.
Grandezza

• Recent Activity: 13 sales in the past 120 days
• Pricing: Median sold $630,000 | Range $238,000–$950,000
• Home Types: Condos, villas, and single-family homes in a golf course community
• Market Snapshot: 7.1 months of supply | 143-day median DOM | 94.1% sale-to-list
Grandezza is experiencing longer timelines, with a 143-day median DOM, the longest among Estero featured communities. The 94.1% sale-to-list ratio points to more aggressive negotiation. Among active listings, 30% previously came off market and returned, and re-listed homes are sitting notably longer than fresh listings (116 vs 68 days), highlighting the role of pricing strategy in this segment.
View homes for sale in Grandezza to evaluate current pricing relative to recent buyer activity.
What Estero Buyers and Sellers Are Asking Right Now
Buyers generally have more time to evaluate options than they did in early 2025. Inventory remains higher than peak years, and days on market have lengthened. At the same time, homes priced in line with recent comparable sales are still drawing prompt buyer interest.
Estero continues to offer a lower entry point. The current median sale price is $530,000, compared to $567,500 in Bonita Springs and $651,000 in Naples. Inventory is also tighter in Estero, which means fewer total options, but often less competition than in higher-priced neighboring markets when homes are priced correctly.
Gradually. Buyer activity has increased, while new listings have declined sharply. That combination typically shows up first as faster movement on well-priced homes rather than across the entire market. Buyers who wait may still find options, but the best-aligned listings are attracting attention sooner than they did in 2024.
No, but the margin for error is smaller. Homes priced realistically from the start are selling more efficiently than those that test higher numbers. Community data shows that once a listing has been re-listed, timelines tend to extend rather than shorten. Pricing strategy is having a greater impact on outcomes than timing alone.
Insurance is influencing decisions earlier in the process, particularly for older homes and properties in higher-risk flood zones. Buyers are asking about premiums, flood status, roof age, and claims history before making offers. With FEMA flood map revisions proposed for parts of Lee County later this year, these conversations are becoming more immediate. Sellers who provide clear insurance documentation upfront are removing a major source of uncertainty.
Final Thoughts
Estero’s smaller size makes price headlines more volatile, but the broader pattern is clear. Buyer engagement is increasing, new supply has pulled back, and outcomes are increasingly determined by how closely pricing aligns with recent sales. Homes positioned correctly are moving. Others are taking longer, regardless of overall market improvement.
Most homeowners feel overwhelmed when it is time to move. At Worthington Realty, we provide personalized guidance and clear communication so you feel heard, valued, and confident in your decisions.
Methodology:
This report draws from Florida Gulf Coast MLS data, including InfoSparks aggregate statistics from January 2021 through January 2026, transaction-level analysis of featured Estero communities, and a re-list review identifying properties that previously expired, terminated, or withdrew within the past 12 months. Trailing averages are used where appropriate to reduce volatility associated with Estero’s smaller monthly transaction volume.