
Buyer demand is rising in Fort Myers, but the market is no longer forgiving pricing mistakes.
January 2026 marks a turning point for the Fort Myers real estate market, as early signs of recovery begin to take hold after an extended period of adjustment. Buyer activity is strengthening, pending sales are rising year over year, and inventory remains elevated enough to keep negotiation firmly in play. Prices continue to sit below last year’s levels, reflecting a market that has been resetting expectations since the post-pandemic peak. The result is a buyer-leaning environment where demand is improving and pricing accuracy has become the clearest dividing line between homes that move forward and those that remain on the market.
Key Takeaways (TL;DR)
- Buyer activity is building. Pending sales rose 28.2% year over year to 582, marking five consecutive months of year-over-year improvement.
- Homes are selling faster. Median days on market dropped from 60 to 43 days, a 28% improvement year over year.
- Inventory still favors buyers. 7.7 months of supply keeps selection high and negotiation common.
- Prices have adjusted from peak levels. The median sale price is 14.6% below the November 2024 peak, but remains 42% above January 2021.
- Pricing accuracy determines outcomes. In Worthington’s featured Fort Myers communities, many current listings previously came off market and returned, showing how seller expectations are being recalibrated locally.
Fort Myers Compared to Southwest Florida
The table below mirrors the Southwest Florida regional comparison exactly, with Fort Myers highlighted to show how the city fits within the broader market context.
| Market | Median Price | YoY Change | Closed Sales | YoY Change | Pending Sales | YoY Change | Months Supply | Median DOM |
|---|---|---|---|---|---|---|---|---|
| Fort Myers | $350,000 | -7.9% | 306 | -1.3% | 588 | +29.5% | 7.7 | 43 |
| Cape Coral | $352,450 | -3.4% | 322 | +6.3% | 595 | +39.7% | 6.4 | 45 |
| Estero | $530,000 | -13.1% | 95 | +3.3% | 160 | +23.1% | 6.9 | 52 |
| Bonita Springs | $567,500 | +0.4% | 120 | +10.1% | 233 | +33.9% | 8.4 | 47 |
| Naples | $651,000 | -3.6% | 510 | -5.7% | 885 | +22.6% | 8.9 | 59 |
| SWFL Region | $419,950 | -4.6% | 1,852 | 0.0% | 3,276 | +28.2% | 8.1 | 53 |
Fort Myers continues to track closely with the broader region, while remaining one of the more price-accessible major markets in Southwest Florida. That positioning appears to be helping unlock buyer activity sooner here than in higher-priced neighboring cities.
For a deeper look at regional trends shaping local markets, see our Southwest Florida Real Estate Market Report – February 2026. To see how this local trend fits into the broader statewide picture, read Florida Housing Ends 2025 Stronger Than Expected (Florida Realtors).
Fort Myers Market Snapshot
- Median Sale Price: $350,000
- Year-over-Year Price Change: -7.9%
- Closed Sales (January): 306 (-1.3% year over year)
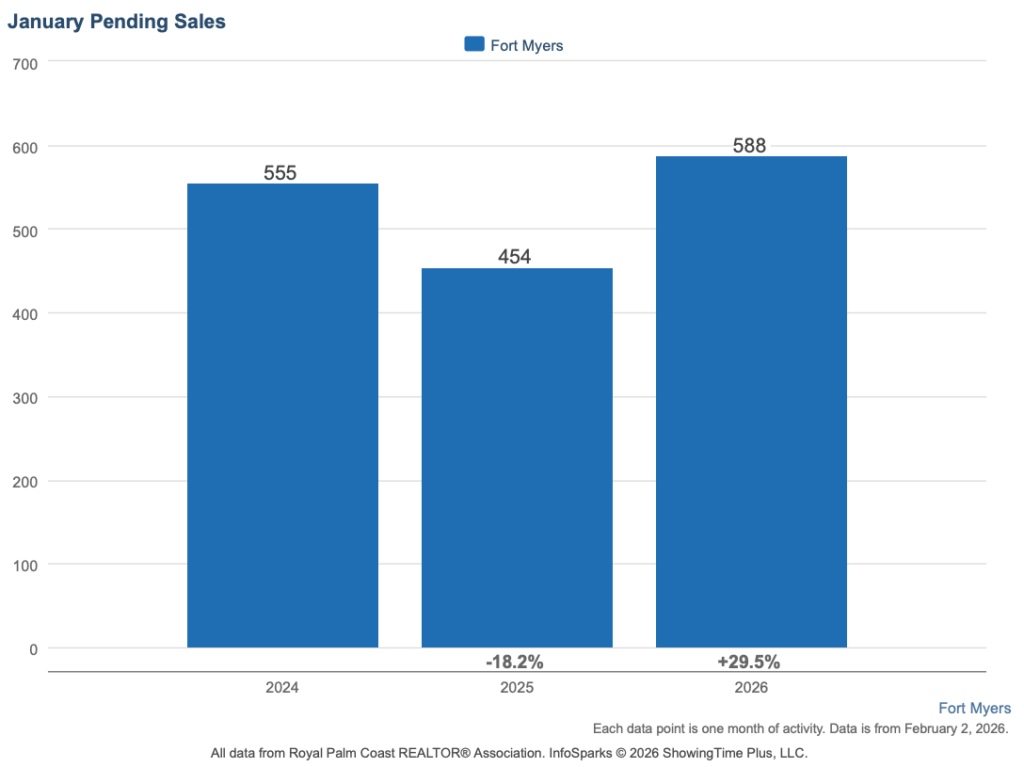
- Pending Sales: 588 (+29.5% year over year)
- Months of Supply: 7.7
- Median Days on Market: 43 days
The improvement in pending sales is one of the most important signals in the January data. While closed sales reflect decisions made months earlier, pending activity captures current buyer intent. Fort Myers is entering the heart of the season with stronger momentum than it had at this time last year.
Supply and Demand in Fort Myers
Fort Myers remains a market that still favors buyers, but conditions are no longer drifting the way they did throughout much of 2024 and early 2025.
Inventory sits at 7.7 months of supply, which typically supports negotiation and gives buyers time to compare options. At the same time, demand is improving. Pending sales have now increased year over year for five consecutive months, signaling a steady recovery rather than a one-month spike.
A useful way to read the pipeline is the relationship between pending contracts and completed sales. With 588 pending sales and 306 closings, Fort Myers is running at roughly 1.9 pending contracts for every closing, which often points to higher closing volume in the months ahead if contracts hold.
This combination creates a market that still favors buyers, but with improving momentum beneath the surface. For buyers evaluating homes for sale in Fort Myers, conditions remain favorable, but competition is returning in well-priced segments.
Pricing Trends and Context Around the Median
The Fort Myers median sale price of $350,000 is down 7.9% year over year, but that figure needs context.
The median now sits 14.6% below the November 2024 peak of $410,000, reflecting a meaningful adjustment from peak pricing. Even so, prices remain 42% above January 2021 levels, underscoring how much long-term appreciation has already occurred.
What has changed is not underlying demand for Fort Myers, but buyer sensitivity to payment levels and value. Buyers are active, but they are more selective, more comparison-driven, and quicker to move on when pricing does not align with recent sales.
Why Pricing Accuracy Determines Outcomes
In a higher-inventory environment, pricing accuracy has become the defining factor.
Homes that enter the market aligned with recent closed sales tend to generate activity early and avoid extended timelines. Homes priced above current comparables often sit, require reductions, or come off the market before returning later at adjusted prices.
This explains why Fort Myers can show improving demand while some sellers still experience slow results. Buyers are active, but they are disciplined.
Fort Myers Featured Communities
These are select communities we focused on this month to illustrate how market conditions vary across Fort Myers. Citywide averages provide context, but outcomes are ultimately decided at the community level.
Timber Creek
- Recent Activity: 32 sales in the past 120 days
- Pricing: Median sold $585,000 | Range $285,000–$845,000
- Home Types: Primarily single-family homes
- Market Snapshot: 3.4 months of supply | 27-day median DOM | 98.2% sale-to-list
Timber Creek continues to show strong buyer engagement relative to the broader Fort Myers market. Homes are selling quickly when pricing aligns with recent sales, and 30% of current listings previously came off market and returned, pointing to modest early pricing adjustments rather than demand weakness.
Explore homes for sale in Timber Creek to see how current pricing compares to recent sales.
Pelican Preserve
- Recent Activity: 56 sales in the past 120 days
- Pricing: Median sold $409,000 | Range $215,000–$950,000
- Home Types: Villas and single-family homes
- Market Snapshot: 4.6 months of supply | 49-day median DOM | 96.1% sale-to-list
With the largest number of recent sales within the communities included in this analysis, Pelican Preserve continues to reflect steady turnover. Negotiation remains typical, and about 34% of active listings have been re-listed, suggesting sellers are adjusting expectations rather than stepping away from the market.
Search homes for sale in Pelican Preserve to compare active listings with recent closed prices.
WildBlue
- Recent Activity: 18 sales in the past 120 days
- Pricing: Median sold $1,500,000 | Range $770,000–$2,600,000
- Home Types: Luxury single-family homes
- Market Snapshot: 5.1 months of supply | 59-day median DOM | 94.1% sale-to-list
WildBlue remains active at higher price points, though individual sales carry more weight given lower volume. Only 9% of current listings have been re-listed, the lowest share within this group of communities, which points to more realistic initial pricing or newer inventory entering the market.
View homes for sale in WildBlue to understand current luxury pricing and negotiation trends.
The Plantation at Fort Myers
- Recent Activity: 34 sales in the past 120 days
- Pricing: Median sold $597,500 | Range $315,500–$1,165,000
- Home Types: Attached and single-family homes
- Market Snapshot: 6.2 months of supply | 37-day median DOM | 95.4% sale-to-list
Sales continue to move when pricing reflects the specific product type. In this community, roughly 32% of active listings previously came off market and returned, and those homes are tending to take longer to sell, reinforcing the impact of initial pricing decisions.
Compare homes for sale in The Plantation to see how today’s inventory aligns with recent sales.
Lexington Country Club
- Recent Activity: 27 sales in the past 120 days
- Pricing: Median sold $275,000 | Range $185,000–$875,000
- Home Types: Condos and attached villas
- Market Snapshot: 9.6 months of supply | 27-day median DOM | 95.7% sale-to-list
Inventory levels remain elevated at Lexington, creating a more price-sensitive environment. While buyers are still active, 28% of current listings have been re-listed, signaling that some sellers are continuing to recalibrate pricing to meet current demand.
Search homes for sale in Lexington Country Club to evaluate pricing relative to recent buyer activity.
Verandah
- Recent Activity: 25 sales in the past 120 days
- Pricing: Median sold $555,000 | Range $175,000–$1,275,000
- Home Types: Townhomes through estate properties
- Market Snapshot: 11.2 months of supply | 71-day median DOM | 95.0% sale-to-list
Verandah is working through higher inventory across a wide range of home types. Timelines are longer, and 39% of active listings previously came off market and returned, highlighting the degree to which sellers are still adjusting to current market conditions.
Explore homes for sale in Verandah to understand current inventory levels and pricing adjustments.
What Fort Myers Homeowners Are Asking
Fort Myers remains buyer-leaning, but the gap is narrowing. Buyers still have choice and negotiating room, but demand has been improving steadily as the season builds. Sellers who align with current pricing are seeing activity sooner, while those who don’t are facing longer timelines. The market favors preparation and realism more than leverage alone.
Prices have adjusted from recent highs, but current trends point toward stabilization rather than continued decline. The market has largely worked through the reset that followed the post-pandemic peak. Buyers remain value-focused, and pricing that reflects recent sales is being rewarded.
Most often, it comes down to pricing. With more inventory available, buyers compare options carefully and move on quickly when a home doesn’t align with recent sales. Many listings that struggled early have returned to the market with adjusted pricing, which reflects how sellers are recalibrating to current conditions rather than a lack of buyer interest.
Timelines vary widely based on pricing and neighborhood. Homes that enter the market aligned with recent sales tend to move within the first several weeks, while homes priced above market expectations can take significantly longer.
For many buyers, conditions remain favorable. Selection is still strong, negotiation is common, and pricing has adjusted from recent peaks. Buyers who focus on recent closed sales and act decisively when value aligns are well positioned in the current market.
Final Thoughts
Fort Myers is entering the seasonal peak with improving demand, moderating inventory, and clearer market signals. Buyers continue to benefit from choice and negotiation room, while sellers who price accurately are seeing meaningful activity.
If you want to explore your options, search Fort Myers homes for sale or contact us to discuss how these trends apply to your neighborhood, property type, and timeline.
Most homeowners feel overwhelmed when it’s time to move. At Worthington Realty, we provide personalized guidance and clear communication so that you feel heard, valued, and confident in your decisions.
Methodology: This analysis draws from three data sources within the Florida Gulf Coast MLS: monthly aggregate statistics from InfoSparks covering January 2021 through January 2026, transaction-level data from closed and active listings in Fort Myers featured communities, and a re-list analysis identifying active listings that previously appeared as terminated, expired, or withdrawn within the prior 12 months. All data reflects residential properties recorded in the MLS during the stated periods.