Learn who wants to be your neighbor in Southwest Florida
Local Insights
Spread the love
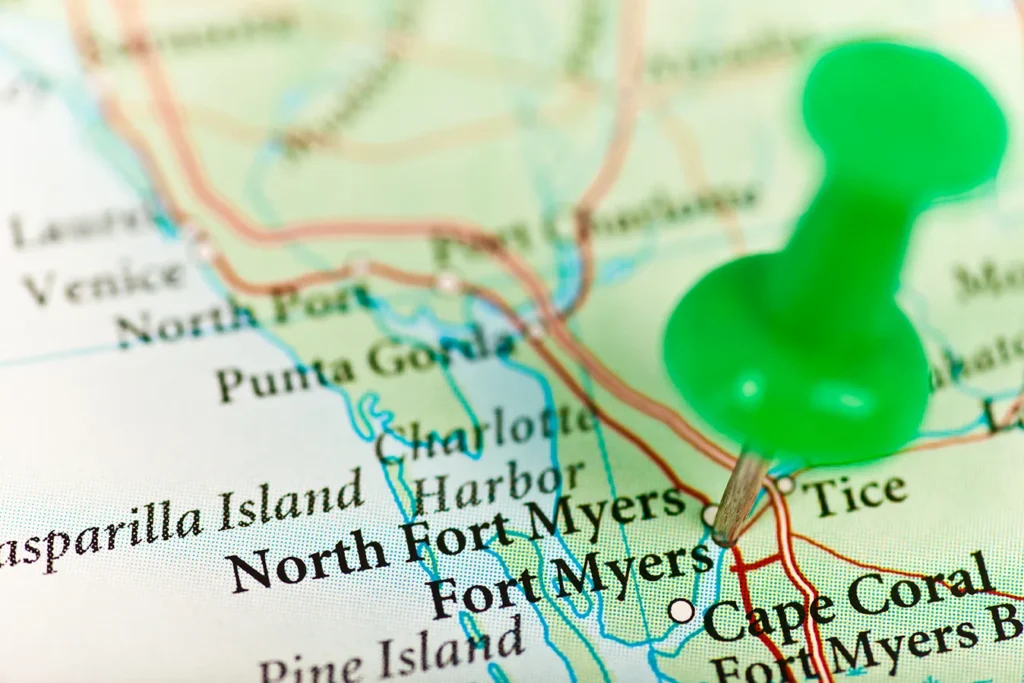
Most out-of-state buyers arriving in Southwest Florida come from Illinois, New York, Massachusetts, New Jersey, Michigan, and Minnesota. IRS migration data shows exactly who is moving to Southwest Florida at the county level, and why the same states produce two very different buyer profiles depending on which county those buyers choose.
Key Takeaways:
Out-of-state buyers arriving in Southwest Florida come predominantly from the Midwest and Northeast.
Lee County and Collier County draw out-of-state buyers from the same states and counties, though the buyers who choose each county are at very different income levels.
Naples buyers carry significantly higher reported income than Fort Myers buyers from the same home counties.
These income differences explain the price gap between the two markets and directly shape how buyers negotiate, what they expect, and how long they will wait for the right property.
If you’ve watched similar homes in Southwest Florida sell to very different buyers at very different prices, the data offers a clear explanation. IRS migration data for tax years 2022 and 2023 identifies, at the county level, exactly who moved to Southwest Florida from out of state during those years and what income they carried. The states sending buyers here have been the same for decades. Illinois. New York. Massachusetts. New Jersey. Michigan. Minnesota. That list holds year after year, through rising rates and falling prices alike.
Lee County and Collier County attract buyers from those same states. The buyers who choose each county, though, are very different financially.
Here is what the numbers show and what it means if you own property here.
IRS migration data traces out-of-state buyers moving to Southwest Florida to specific counties in Illinois, New York, Massachusetts, New Jersey, Michigan, and Minnesota.
The IRS data identifies who is moving to Southwest Florida at the county level
IRS Statistics of Income publishes county-to-county migration data from actual tax returns. It tracks where households moved and what income they reported. That income figure, called adjusted gross income or AGI, is a solid measure of financial standing. It does tend to undercount wealth from business ownership and investments, which is worth keeping in mind for the type of buyer this data describes.
Illinois, New York, New Jersey, and Massachusetts have some of the highest tax bills in the country, expensive housing, and winters that get harder to justify the older you get. Southwest Florida is the opposite on all three counts. That gap has been driving people south for thirty years. The IRS data shows who is acting on it.
Lee and Collier attract buyers from the same states. The data shows which buyers from those states choose each county.
Chicago and the Illinois suburbs lead all origin markets for Collier County
The top origin counties for Collier County, which includes Naples, tell a clear story about who is moving to Southwest Florida and choosing this market specifically.
Cook County, IL is Chicago and its immediate suburbs. It leads with 639 individuals at an average AGI of $712,000. In fact, Chicago’s contribution goes well beyond Cook County. DuPage County, the western suburbs including Naperville and Wheaton, added 282 individuals at $580,000. Lake County, the northern shore communities, contributed 161 more at $662,000. Will County, southwest of the city, sent fewer people but at the highest average income in the entire dataset: $1,012,000 per return. Chicago, across all four of its surrounding counties, is the single largest source of Naples buyers. Each of those counties sent high-income households.
Hennepin County, MN (the Minneapolis metro) contributed 235 individuals at an average AGI of $707,000. Minneapolis is farther from Southwest Florida than most cities on this list. Its strong showing tells you something: the buyer coming from Hennepin County did their research and made a deliberate choice. This is a financially established buyer who is likely comparing Naples against a short list of high-end destinations.
Long Island and the Boston metro complete the picture. Suffolk County, NY sent 234 individuals to Collier at $313,000. Nassau County added 208 more at $378,000. From Massachusetts, Middlesex County, which includes Lexington, Concord, and Cambridge, contributed 199 individuals. Norfolk County, which includes Wellesley, Needham, and Brookline, sent 158 individuals at an average AGI of $956,000. Barnstable County is Cape Cod. It added 187 individuals, most likely households already comfortable with seasonal living who are making a permanent move south. In New Jersey, Monmouth County contributed 182 individuals at $453,000 and Ocean County added 111 more.
Three patterns define the Collier County out-of-state buyer
Three things stand out from the table below. First, multiple Illinois counties appear in the top 25, not just Cook. Chicago is systematically sending buyers to Naples across all its major suburban rings. Second, the Massachusetts counties cluster at high income levels, with Norfolk County averaging nearly $1 million in AGI. Third, every county in the top ten comes from a metro area with a strong professional or executive class. This is a buyer who has accumulated significant assets and is making a considered decision.
Origin county
State
Individuals
Avg AGI
Cook County
IL
639
$712,000
DuPage County
IL
282
$580,000
Hennepin County
MN
235
$707,000
Suffolk County
NY
234
$313,000
Oakland County
MI
224
$435,000
Nassau County
NY
208
$378,000
Middlesex County
MA
199
$356,000
Barnstable County
MA
187
$340,000
Monmouth County
NJ
182
$453,000
Lake County
IL
161
$662,000
Norfolk County
MA
158
$956,000
Essex County
MA
157
$681,000
Plymouth County
MA
153
$387,000
Bergen County
NJ
147
$172,000
Los Angeles County
CA
141
$245,000
New York County
NY
137
$410,000
Western CT Planning Region
CT
136
$491,000
Westchester County
NY
128
$173,000
St. Louis County
MO
127
$591,000
Queens County
NY
123
$111,000
Will County
IL
123
$1,012,000
Cuyahoga County
OH
122
$447,000
Capitol Planning Region
CT
118
$184,000
Fairfax County
VA
112
$309,000
Ocean County
NJ
111
$401,000
Source: IRS Statistics of Income, County-to-County Migration Data, tax years 2022–2023. Collier County, FL (FIPS 12021). Excludes within-Florida moves.
The same origin regions produce two distinct buyer profiles
Who is moving to Southwest Florida and choosing Lee County comes from the same states at a lower income tier
The origin counties for Lee County, which includes Fort Myers, Cape Coral, Estero, and Bonita Springs, read almost identically. Cook County, IL. Suffolk County, NY. Hennepin County, MN. Oakland County, MI. DuPage County, IL. The same origin regions. The same feeder counties.
However, the AGI figures tell a different story.
Cook County, IL, households moving to Lee County arrived with an average AGI of $292,000. The Cook County, IL, households who chose Collier County averaged $712,000. That is the same origin county, the same Chicago, sending buyers to two different Southwest Florida markets at income levels more than $400,000 apart.
The buyers who choose Naples and the buyers who choose Fort Myers are making different decisions from the same starting point. Price point and life stage are doing the sorting.
Southwest Florida is not one buyer pool. It is two distinct groups arriving from the same regions with different financial realities. The market price gap between Naples and Fort Myers reflects exactly that.
As a result, the real estate market confirms what the IRS data suggests. As of March 2026, Naples carries a median sale price of $587,500 at $326 per square foot. By comparison, Fort Myers sits at $335,000 and $204 per square foot. The income gap between the two buyer pools and the price gap between the two markets are telling the same story.
The same holds across every shared origin county. Hennepin County, MN, buyers going to Collier averaged $707,000. The same county’s buyers going to Lee averaged $554,000. Massachusetts buyers in Middlesex County, MA, averaged $356,000 for Collier versus $307,000 for Lee. The gap narrows as you move down the income spectrum, but it never closes. Higher-income households can choose Naples without financial constraint. Others optimize for value and land in Lee County. Income and life stage determine which county people moving to Southwest Florida from out of state end up in. The income data shows the sorting mechanism. The price gap between the two markets shows the outcome.
Lee County draws more buyers. Collier County draws higher-income buyers.
In addition, Lee County draws more buyers overall: 18,852 out-of-state individuals in the period versus 9,662 for Collier. Volume favors Lee. Income favors Collier. Both are receiving consistent, meaningful buyer flow from the same places.
Lee County is not simply a lower-cost alternative to Collier. It is attracting a broader mix of buyers, including remote workers, business owners, and households making a second relocation within the Sun Belt. That diversity is part of what makes it a different kind of market.
Spring training built lasting familiarity between Lee County and its top feeder markets
Furthermore, there is a long-standing familiarity pipeline that the data reflects but does not explain on its own. The Boston Red Sox hold spring training at JetBlue Park in Fort Myers. The Minnesota Twins prepare at Lee Health Sports Complex. Middlesex County and Suffolk County, Massachusetts are deep Red Sox country and two of Lee County’s top out-of-state origin counties. Hennepin County, Minnesota is the heart of Twins territory and ranks third. For decades, households in Boston and Minneapolis have been spending time in Lee County before ever considering a move here. Familiarity precedes relocation decisions, and Lee County has been building that familiarity with its strongest feeder markets through baseball for decades.
Three characteristics separate the Lee County buyer pool from Collier’s
Three things stand out from the table below. First, Clark County, NV (Las Vegas) appears at number eight with 227 individuals and an average AGI of $71,000. That county does not appear in Collier’s top 25 at all. Maricopa County, AZ (Phoenix) shows up at 199 individuals for Lee and is similarly absent from Collier. Sun Belt movers, households already in warmer climates making a secondary relocation, are choosing Lee County rather than Collier. Second, Queens County, NY appears in both tables but at a much lower AGI than the Long Island suburbs. Third, Wayne and Macomb counties in Michigan, Detroit’s working-class suburbs, appear in the Lee table and not Collier’s. The Detroit suburbs sending buyers to Naples come from Oakland County, MI. The Detroit suburbs sending buyers to Fort Myers come from a broader range.
Origin county
State
Individuals
Avg AGI
Cook County
IL
547
$292,000
Suffolk County
NY
433
$152,000
Hennepin County
MN
375
$554,000
Oakland County
MI
326
$201,000
DuPage County
IL
320
$191,000
Will County
IL
269
$129,000
Lake County
IL
235
$238,000
Clark County
NV
227
$71,000
Nassau County
NY
224
$113,000
Ocean County
NJ
221
$116,000
Middlesex County
MA
216
$307,000
Queens County
NY
206
$75,000
Los Angeles County
CA
205
$86,000
Maricopa County
AZ
199
$91,000
Capitol Planning Region
CT
188
$219,000
Monmouth County
NJ
184
$208,000
Franklin County
OH
181
$136,000
Wayne County
MI
178
$105,000
Macomb County
MI
178
$99,000
Bergen County
NJ
173
$101,000
Cuyahoga County
OH
172
$372,000
Harris County
TX
172
$102,000
Essex County
MA
169
$266,000
Plymouth County
MA
162
$448,000
St. Louis County
MO
161
$391,000
Source: IRS Statistics of Income, County-to-County Migration Data, tax years 2022–2023. Lee County, FL (FIPS 12071). Excludes within-Florida moves.
The buyers in this data entered a very different Southwest Florida market
The IRS county-to-county data used in this piece covers tax years 2022 and 2023. These are the most current figures available for tracking who is moving to Southwest Florida from out of state at the county level. The 2023–2024 dataset has not yet been released. It is worth understanding what was happening in Southwest Florida when those buyers arrived, because the market they entered looks different from the one buyers find today.
In mid-2022, the regional median sale price was approaching $465,000. Fewer than 8,000 homes were listed for sale across all five cities. Median days on market had compressed to single digits in some markets. Consequently, buyers who moved during those years arrived into a low-inventory, near-peak market where homes sold in days and sellers held most of the leverage.
By March 2026, that picture looks different. Active listings across the region have grown to more than 20,000, nearly three times the 2022 level. Median days on market sits at 63 days region-wide. The regional median sale price has pulled back to $410,000, and price per square foot has fallen from its peak in every city.
The states sending buyers to Southwest Florida keep losing residents
Despite those market changes, the same states keep sending buyers. Cook County, IL, Hennepin County, MN, Suffolk County, NY, and Middlesex County, MA, appear in this data because people there have been making long-term decisions about taxes, climate, and where they want to spend their lives. Those decisions keep being made regardless of what the SWFL market is doing in any given year.
According to the U.S. Census Bureau’s American Community Survey, Florida recorded a net gain of 67,630 residents from interstate migration in 2024. Florida is still gaining people. The numbers are lower than the pandemic peak because that peak was unusual, not because the trend has reversed. Meanwhile, Illinois, New York, New Jersey, and Massachusetts are all still losing residents — which means the pool of households in those states making long-term decisions about where to go next has not shrunk.
The 2023–2024 IRS migration data, when released, will reflect buyers who moved into a softening market and may show some changes in volume from the peak period. Worthington Realty will update this piece when that data becomes available.
Knowing your buyer’s origin changes how you price, present, and negotiate
Collier County sellers are competing for a high-income, high-expectation buyer
Your buyer came from Chicago’s North Shore, the western suburbs of Minneapolis, Wellesley or Needham outside Boston, or the New Jersey shore towns of Monmouth County, NJ. They are among the people moving to Southwest Florida from the country’s highest-income markets. According to the Collier County Economic Development Office, Collier County has more Fortune 500 CEOs per capita than any other community in the country. That tells you something about who is on the other side of your transaction. They have owned before, likely in a market where $1.2 to $1.8 million was a normal home price.
Buyers evaluate price against what they just sold, not in isolation. That prior value is their reference point, and it changes how they read your listing entirely. When they arrive in Naples and evaluate a $600,000 property, they are thinking about what $600,000 buys relative to what they left behind. This makes them relatively price-tolerant by local standards and relatively demanding about quality, because their expectations were formed in a high-quality market.
Price to where buyers are transacting, not where you listed last year
Specifically, the Ask-Bid Gap in Naples sits at 16.0%. Read that correctly: it reflects a pricing problem, with active buyers underneath it. Naples pending sales rose 13.6% year over year in March 2026. Buyers are going under contract regularly. The gap reflects sellers anchored to 2024 asking prices in a market where buyers are transacting at current values. A meaningful share of Collier buyers arrive with significant equity or cash from their prior home sale, which makes them less sensitive to mortgage rates and more sensitive to whether a property is priced and presented correctly. Furthermore, many are still professionally active, running businesses, managing investments, or relocating their work alongside their residence. They have a high opportunity cost of time. They will not wait out a mispriced listing. Meet that standard and buyers in this market will find you.
Lee County sellers meet buyers who already believe this market offers value
Your buyer pool is broad and still growing. New York and New Jersey dominate by volume, but the range of origin counties in the Lee table, from the Chicago suburbs to Las Vegas to Phoenix to Houston, reflects a buyer who has compared SWFL against other warm-weather markets before arriving. Fort Myers carries the tightest Ask-Bid Gap in the region at 5.3%, meaning sellers pricing to current comps are meeting buyers where they are. Value clarity and community character drive decisions here. Your buyer arrived already believing this market represents value relative to where they came from. Price above that belief and you give them a reason to walk away from a transaction they wanted to make.
Out-of-state buyers arrive with equity, preparation, and clear expectations
A share of the competition for well-priced, well-presented homes comes from buyers who did their homework in Chicago, Minneapolis, and Boston before they ever landed here. They arrive with clear expectations and equity from high-cost markets. That raises the bar on what sellers bring to the table and shapes the market you are entering as a buyer. Know your number and be ready to act when the right property appears. Browse available homes across Southwest Florida.
Southwest Florida draws buyers from a traceable, consistent source
Behind every transaction in Southwest Florida is a household that left somewhere specific to be here. The data on who is moving to Southwest Florida names those places one county at a time. 639 households from Cook County, IL. 282 from DuPage County, IL. 235 from Hennepin County, MN. 199 from Middlesex County, MA.
Each of those households knows others back home who are running the same numbers: the same tax bills, the same winters, the same questions about where to spend the next chapter. These origin regions behave like a referral network that has been self-reinforcing for decades.
Specific people from specific places, arriving with expectations formed somewhere else entirely, are shaping what you buy, sell, and compete against in Southwest Florida. Understanding that is the foundation of every conversation we have with buyers and sellers here. It is why the Worthington market reports go deeper than anyone else’s in Southwest Florida.
When you are ready to make your move in this market, the next steps can still feel like a lot. At Worthington Realty, we provide personalized guidance and clear communication so that you feel heard, valued, and confident in your decisions. [Contact us.]
Data sources
Collier County Economic Development Office. Why Collier County. collieredo.org.
IRS Statistics of Income Division. County-to-County Migration Data, Calendar Years 2022–2023. Individual Income Tax Returns. Internal Revenue Service.
U.S. Census Bureau. American Community Survey 1-Year Estimates, 2024. State-to-State Migration Flows Table. U.S. Department of Commerce.
Michael Davis is one of the owners of Worthington Realty in Southwest Florida. He leads the brokerage’s market research and writes its MLS-based market reports and analysis. A Gallup-Certified Strengths Coach, Michael also works with agents to build personal brands rooted in their natural strengths, bringing clarity and confidence to how they serve homeowners.