
A $50,000 Gap Shows Where Homes Are Priced Versus Where Buyers Actually Closed
This Cape Coral real estate market update shows the city entering 2026 with a clear difference between where many homes are currently priced and where buyers actually closed during 2025. The median list price sits at $434,995 for homes currently listed, while the median home sold last year closed at $375,000. That gap does not mean homes need to be priced near the median to sell. Homes sell when they are priced in line with recent comparable sales in their own price range. What the gap shows is that more inventory is sitting in higher price brackets, while most buyer activity has been concentrated below them. This report breaks down how pricing, supply, and buyer activity played out across Cape Coral’s housing market.
All data in this report comes from the Royal Palm Coast REALTOR® Association and Florida Gulf Coast MLS via Stellar MLS and is current as of January 14, 2026.
Key Takeaways (TL;DR)
- The median active list price ($434,995) sits above the 2025 median closed sale price ($375,000) because more inventory is concentrated in higher price bands than where sales occurred.
- Homes priced between $300,000 and $400,000 produced 39% of 2025 sales while representing just 27% of current active inventory.
- Nearly half of active listings (45.9%, or 1,391 homes) have accumulated 90 days or more on the market.
- More than one in four active listings (27.6%, or 835 homes) previously failed to sell in 2025 and later returned to the market.
- Active inventory shows a bimodal pattern, with 22% listed for 30 days or less and another 22% on the market for more than 180 days.
Where Sales Happened Versus Where Inventory Sits
Closed sales in 2025 clustered within specific price ranges rather than around a single price point. Homes priced between $300,000 and $400,000 produced 2,017 sales, representing 39.2% of all transactions. That same range accounts for 26.7% of current active inventory.
At higher price points, inventory is more heavily concentrated relative to historical transaction volume. Homes priced at $500,000 and above represent more than 38% of active listings but generated less than 28% of 2025 sales. This reflects differences in buyer depth across price ranges rather than a universal pricing issue.
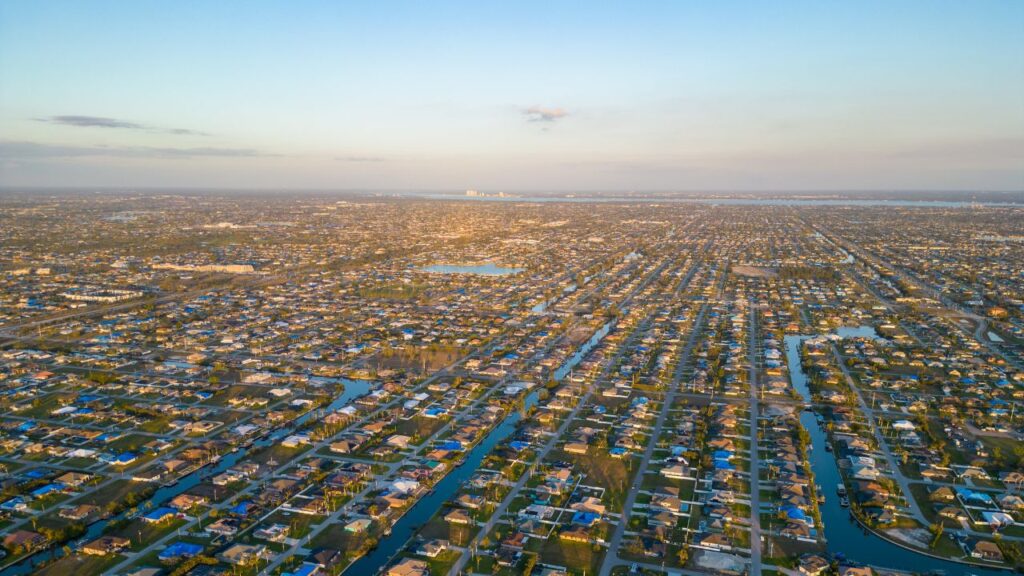
These patterns appeared across Cape Coral, from established areas in the southeast to newer construction concentrations in the northwest sections of the city.
Cape Coral Real Estate Market Price Band Distribution
| Price Band | Active | % of Active | 2025 Closed | % of Closed | Months Supply |
|---|---|---|---|---|---|
| Under $300K | 524 | 17.3% | 871 | 16.9% | 7.2 |
| $300K–$400K | 809 | 26.7% | 2,017 | 39.2% | 4.8 |
| $400K–$500K | 542 | 17.9% | 838 | 16.3% | 7.8 |
| $500K–$750K | 619 | 20.4% | 901 | 17.5% | 8.2 |
| $750K–$1M | 251 | 8.3% | 267 | 5.2% | 11.3 |
| $1M+ | 283 | 9.3% | 250 | 4.9% | 13.6 |
Within the lowest price tier, property type plays a role. Of the 138 active listings priced under $200,000, approximately 65% are condominiums, which influences demand patterns differently than single-family homes.
Days on Market Patterns
Time on market reflects how closely listings align with what similar properties have recently sold for. Homes that sold in 2025 spent a median of 57 days on the market. Current active listings show a median of 79 days, creating a 22-day difference between sold and available inventory.
Marketing time increases as price ranges move higher. Closed sales under $300,000 had a median of 36 days on market. Homes priced between $300,000 and $400,000 averaged 54 days, rising steadily through higher ranges and reaching 76 days for homes priced between $750,000 and $1 million.
Among active listings, the distribution has become clearly bimodal. About 22% of homes have been listed for 30 days or less, while another 22% have been on the market for more than 180 days. Nearly half of all active inventory now sits beyond the 90-day mark.
Relist Activity and Price Adjustments
Relisted homes represent a meaningful share of current supply. Of the 3,028 active listings, 835 share addresses with homes that expired, withdrew, or were terminated during 2025.
These properties returned to the market after earlier pricing failed to produce a sale. When they did sell, the median adjustment from the highest failed list price to the final sold price was a 9.96% reduction. The middle half of those adjustments ranged from roughly 13% to about 5%, reflecting recalibration to recent market evidence for comparable homes.
Across the full year, 5,129 unique homes sold out of 8,959 unique addresses that appeared in the 2025 market, producing a success rate of 57.3%.
How Cape Coral Buyers and Sellers Met on Price
Active listings currently carry a median price of $243 per square foot. Closed sales in 2025 settled at a median of $220 per square foot, while pending contracts sit slightly lower at $215 per square foot.
Negotiated outcomes support this pattern. Homes that closed in December 2025 achieved a median of 97.0% of their last list price.
Pending activity further shows where agreement is occurring. Of the 560 homes under contract, 347 are priced below $400,000. The median pending list price of $364,695 is closely aligned with recent sales activity and sits well below the median active list price.
Newer construction also shapes expectations. Homes built in 2020 or later make up 38.7% of current active inventory and accounted for 40.5% of all closed sales in 2025.
Cape Coral within the Southwest Florida context
December 2025 monthly figures provide additional context across Southwest Florida markets.
| Market | Dec 2025 Median | Closed Sales | Pending | New Listings | Homes for Sale | Months Supply | Median DOM | $/Sqft | % of List |
|---|---|---|---|---|---|---|---|---|---|
| Fort Myers | $338,500 | 426 | 368 | 607 | 3,211 | 7.3 | 43 | $208 | 95.7% |
| Cape Coral | $363,800 | 421 | 403 | 635 | 2,869 | 6.0 | 57 | $218 | 97.0% |
| Estero | $499,950 | 127 | 93 | 146 | 730 | 6.5 | 72 | $267 | 95.4% |
| Bonita Springs | $550,000 | 142 | 116 | 213 | 1,135 | 8.1 | 41 | $319 | 95.4% |
| Naples | $570,000 | 715 | 543 | 929 | 5,437 | 8.2 | 58 | $321 | 95.3% |
For broader regional context, see the 2025 Southwest Florida Housing Market Review.
Neighborhood Snapshots: How Five Cape Coral Communities Performed in 2025
Cape Coral’s neighborhoods reflected different market conditions in 2025, shaped by housing age, internal competition, and how pricing expectations adjusted over time. While citywide trends provide context, buyers made decisions by comparing homes within specific neighborhoods.
These snapshots reflect all 2025 listing activity within each community, including sales, relists, expirations, withdrawals, and current inventory. Rather than ranking performance, this view explains why homes moved more quickly in some areas and took longer in others.
Cape Coral Yacht Club
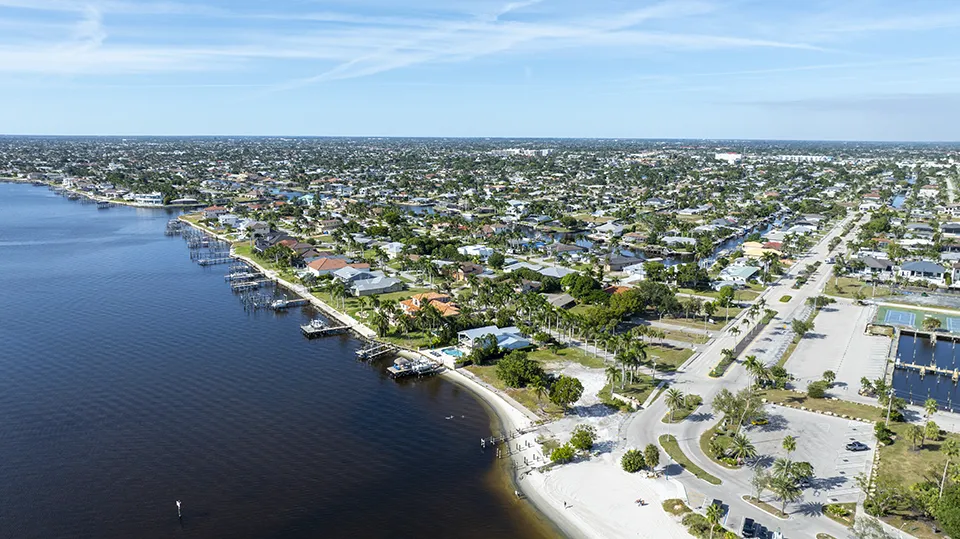
The Yacht Club area showed steady buyer interest, influenced by older housing stock dating largely to the 1960s. The median sold price finished at $527,500. About 29% of the homes currently for sale had already been listed once before and failed to sell during 2025, indicating that many sellers needed more than one attempt to find a buyer.
Homes that sold closed in a median of 62 days. Nearly half of all active listings (47%) have already been on the market for more than 90 days, which explains why some listings feel slow-moving. Buyers were active here, but homes that did not adjust after an initial attempt tended to remain on the market while better-aligned listings sold first.
Explore current homes for sale in Cape Coral Yacht Club.
Cape Harbour

Cape Harbour operates as a self-contained waterfront market where buyers primarily compare homes against other options inside the community. The median sold price was $600,000, with 41 total sales during 2025. Active listings closely matched that annual sales total, creating steady internal competition.
About 41% of current listings had already tried and failed to sell earlier in the year. Homes that eventually sold spent a median of 80 days on the market. When relisted homes did sell, they typically closed about 15% below their highest prior asking price, showing that price resets were often needed before buyers committed. Even so, 55% of homes that entered the market ultimately sold, the highest success rate among the featured communities.
Browse homes for sale in Cape Harbour, Cape Coral.
Cape Royal Golf Club

Cape Royal reflected a slower-paced market where buyers were selective and turnover was limited. With only 18 sales in 2025 and a median sold price of $710,000, buyers had fewer transactions to compare against when making decisions.
Homes that sold took a median of 102 days to go under contract. About 31% of active listings had already been through at least one failed listing attempt, and more than half of current listings (54%) have now been on the market for over 90 days. When relisted homes sold, they typically required about a 14% reduction from earlier asking prices. Sales still occurred, but pricing accuracy mattered more in a market with fewer active buyers.
See current homes for sale in Cape Royal Golf Club, Cape Coral.
Sandoval
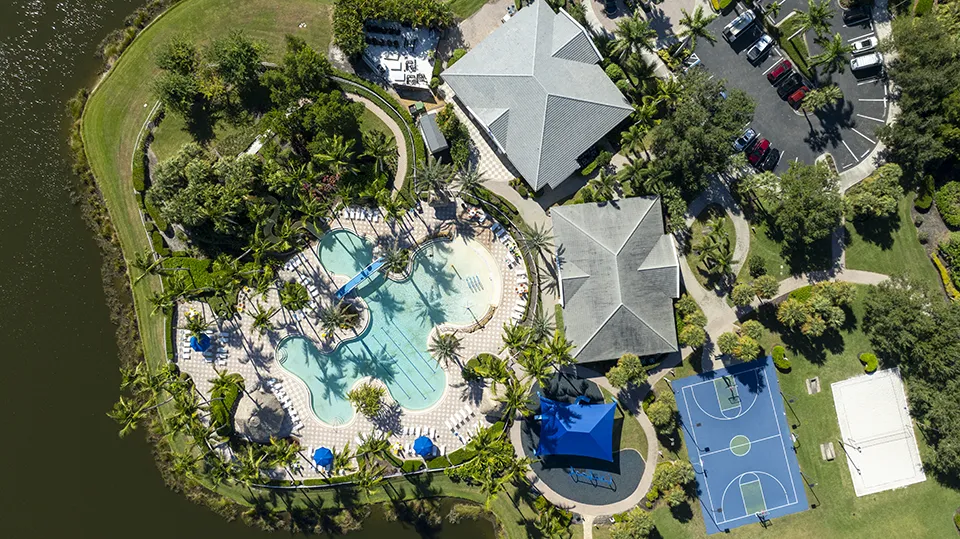
Sandoval showed the cleanest inventory profile among the featured communities. The median sold price was $385,000, and fewer homes lingered on the market compared to other Cape Coral neighborhoods.
About 29% of active listings had previously failed to sell, but overall inventory felt fresher because all homes were built between 2005 and 2018, limiting wide differences in condition and layout. Homes that sold closed in a median of 60 days. When relisted homes did sell, they typically required around a 9% price adjustment, smaller than in higher-priced communities. Buyers here responded more quickly when listings entered close to recent sales of similar homes.
Find homes for sale in Sandoval, Cape Coral.
Tarpon Point
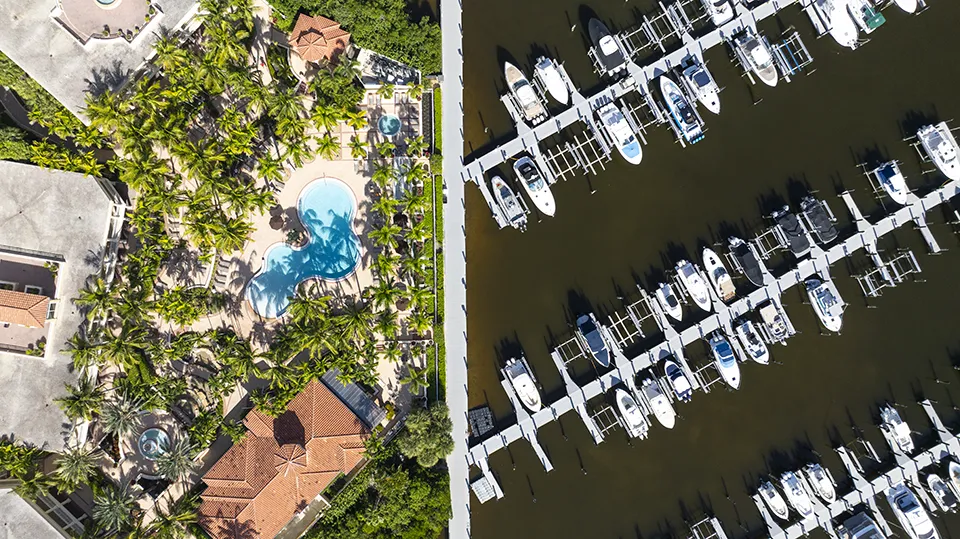
Tarpon Point Marina functioned as a higher-priced waterfront market with fewer buyers actively shopping at any given time. The median sold price reached $960,000, but activity was more limited than in other communities.
More than 60% of homes currently for sale had already tried and failed to sell earlier in 2025, the highest share among the featured neighborhoods. There are more homes for sale now (23) than sold during all of 2025 (17), which helps explain why listings took longer to move. Homes that sold spent a median of 102 days on the market, and only about half of all homes that entered the market ultimately sold. Transactions still occurred, but buyers focused closely on pricing relative to recent waterfront sales.
Explore current homes for sale in Tarpon Point Marina, Cape Coral.
What Cape Coral Homeowners Are Asking
No. Homes sell when they are priced in line with recent comparable sales. The gap reflects how inventory and demand are distributed across price ranges, not a universal pricing target.
Higher price ranges carry more inventory relative to buyer depth. Months of supply increase steadily above $500,000, which typically results in longer marketing periods.
Homes that failed and later sold in 2025 typically adjusted about 9.96% from their highest failed list price to align with current market evidence.
Homes that sold in 2025 spent a median of 57 days on the market. Active listings currently sit at a median of 79 days, with nearly half beyond 90 days.
Yes. There are 560 homes under contract, representing about 18.5% of active inventory. Pending prices closely reflect where comparable properties have recently sold.
Final Thoughts
Cape Coral real estate market data shows that outcomes are shaped by price-range competition and alignment with recent comparable sales. The observed gap between active and closed prices reflects how inventory and demand are distributed, not a single price point that defines success.
You can explore current listings by searching Cape Coral homes for sale, or contact our team to review recent comparable sales and pricing within your specific area.
Most homeowners feel overwhelmed when it’s time to move. At Worthington Realty, we provide personalized guidance and clear communication so that you feel heard, valued, and confident in your decisions.
Sources & Methodology: This report uses MLS data from the Royal Palm Coast REALTOR® Association and Florida Gulf Coast MLS via Stellar MLS. Listings were matched at the address level to track properties across active, pending, closed, expired, withdrawn, and terminated statuses. Relist % reflects the share of active listings that previously failed to sell in 2025, while Stale % measures active listings with 90 or more cumulative days on market. Success Rate represents the share of unique properties that sold out of all properties that entered the 2025 market. Relist Adjustment captures the median change from the highest failed list price to the final sold price for properties that later closed. All figures are calculated directly from the referenced datasets without estimation.