
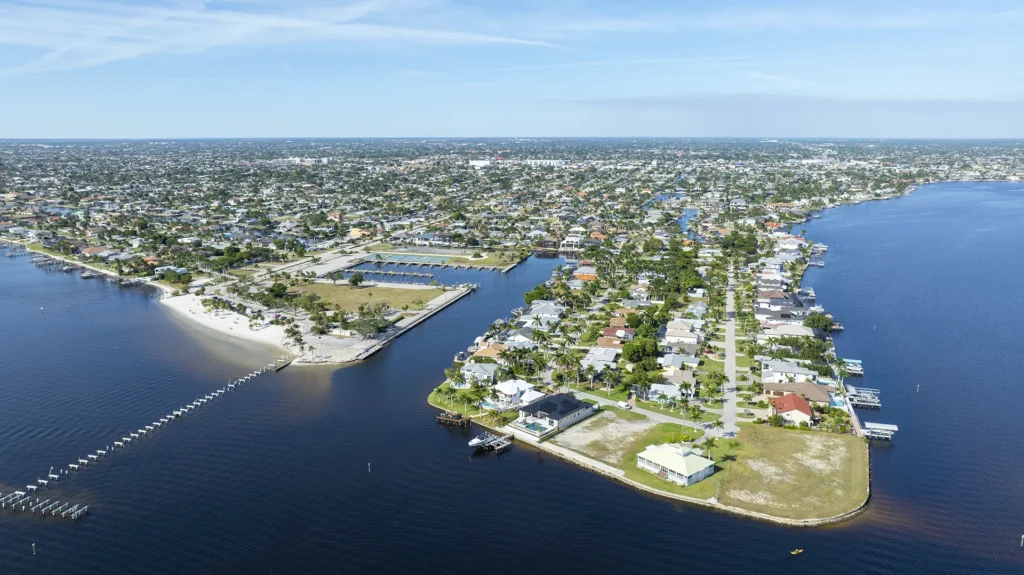
Cape Coral adjusted earlier than most Southwest Florida markets, and buyer activity is beginning to follow.
January 2026 data from the Florida Gulf Coast MLS (FGCMLS via Stellar MLS) points to a clear shift in buyer activity within the Cape Coral real estate market. Pending sales rose nearly 40% year over year, showings per listing increased more than 45%, and months of supply fell to the lowest level among major Southwest Florida cities—signs that buyer interest is translating into contracts.
Prices remain below peak levels, and buyers appear more willing to engage at today’s pricing. Homes that align with recent comparable sales are drawing interest, while others continue to face longer timelines.
Cape Coral experienced one of the largest price adjustments in the region, declining about 19% from peak. That recalibration, combined with tightening supply and rising pending activity, is changing how the market is functioning compared to the past two years.
Key Takeaways (TL;DR)
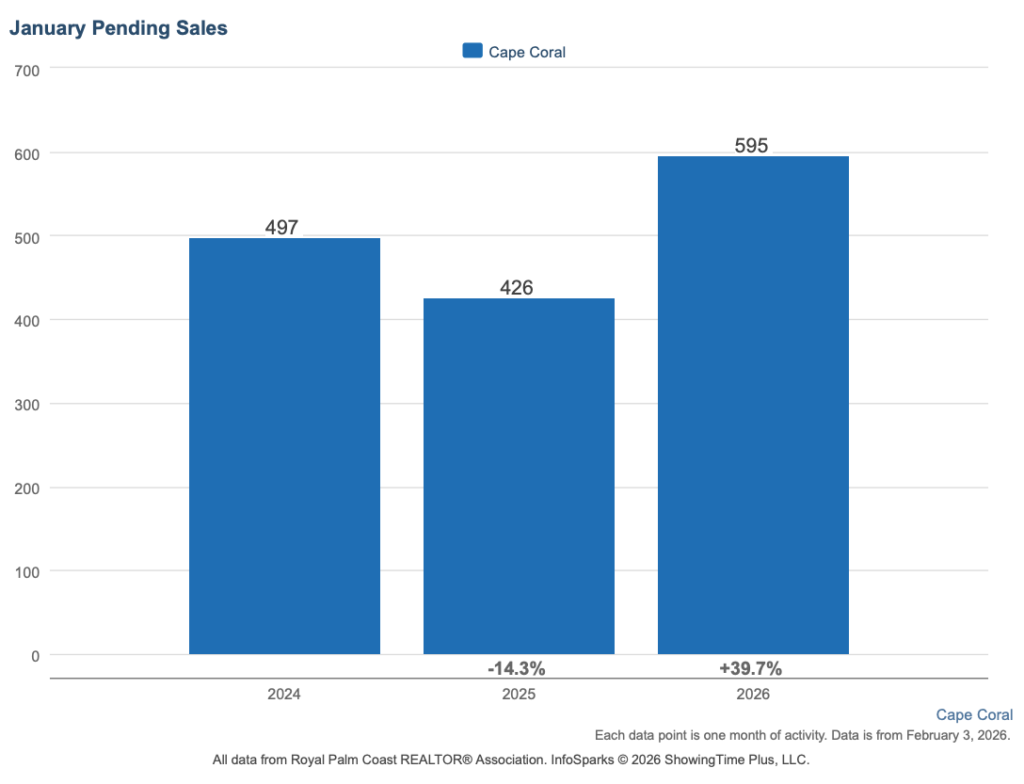
- Buyer activity is re-engaging. Pending sales rose 39.7% year over year to 595, one of the strongest increases in Southwest Florida. Showings per listing increased 45.5%.
- Inventory is tightening. Active listings declined 24.4% year over year, and months of supply improved from 9.1 to 6.4, the lowest level among major SWFL markets.
- Closed sales are rising. Cape Coral posted a 6.3% year-over-year increase in closings, one of the few markets with positive growth.
- Prices have adjusted. The median sits 19.3% below the April 2022 peak, while still 20% above January 2021.
- Pricing accuracy continues to determine outcomes. In Worthington’s featured Cape Coral communities, re-list rates range from 27% to 60%, showing how seller expectations are still recalibrating at the neighborhood level.
Cape Coral Compared to Southwest Florida
The table below shows how Cape Coral fits within the broader regional context, with Cape Coral highlighted.
| Market | Median Price | YoY Change | Closed | Closed YoY Change | Pending | Pending YoY Change | Months Supply | Median DOM |
|---|---|---|---|---|---|---|---|---|
| Fort Myers | $350,000 | -7.9% | 306 | -1.3% | 588 | +29.5% | 7.7 | 43 |
| Cape Coral | $352,450 | -3.4% | 322 | +6.3% | 595 | +39.7% | 6.4 | 45 |
| Estero | $530,000 | -13.1% | 95 | +3.3% | 160 | +23.1% | 6.9 | 52 |
| Bonita Springs | $567,500 | +0.4% | 120 | +10.1% | 233 | +33.9% | 8.4 | 47 |
| Naples | $651,000 | -3.6% | 510 | -5.7% | 885 | +22.6% | 8.9 | 59 |
| SWFL Region | $419,950 | -4.6% | 1,852 | 0.0% | 3,276 | +28.2% | 8.1 | 53 |
Cape Coral stands out this month for the combination of tightening inventory and rising contract activity, which appears to be supporting renewed buyer engagement.
For a deeper look at regional trends shaping local markets, see our Southwest Florida Real Estate Market Report – February 2026. To see how this local trend fits into the broader statewide picture, read Florida Housing Ends 2025 Stronger Than Expected (Florida Realtors).
Cape Coral Market Snapshot
- Median Sale Price: $352,450
- Year-over-Year Price Change: -3.4%
- Closed Sales (January): 322 (+6.3% year over year)
- Pending Sales: 595 (+39.7% year over year)
- Months of Supply: 6.4
- Median Days on Market: 45 days
The combination of rising closed sales and increasing pending activity reflects a clear change in buyer behavior. Where activity was cautious through much of 2024 and early 2025, buyers are now re-engaging as pricing aligns more closely with expectations.
Supply and Demand in Cape Coral
Cape Coral’s inventory profile has changed meaningfully over the past year.
Active listings and months of supply have both come down from the elevated levels that defined much of 2024, reducing the drag that kept transactions from moving forward consistently.
Buyer activity is also translating into contracts. With 595 pending sales recorded in January, demand is no longer just visible in showings but showing up in signed agreements as well.
Buyers searching for homes for sale in Cape Coral still have options, though the pace of sales activity in the Cape Coral housing market has picked up noticeably.
Pricing Trends and Context Around the Median
Cape Coral experienced a significant price correction after its 2022 peak, which helps explain why buyers are re-engaging at today’s pricing and why many sellers, depending on when they bought, still have meaningful equity even in a recalibrated market.
The median sale price of $352,450 sits 19.3% below the April 2022 peak of $437,000. Year over year, prices are down just 3.4%, a smaller decline than several neighboring markets.
Even after the correction, prices remain approximately 20% above January 2021 levels. The market has given back a portion of the rapid 2021–2022 gains, but long-term appreciation remains intact.
This pricing reset appears to be one reason buyer engagement is returning sooner here. Buyers are more willing to transact at today’s levels, even without expectations of a rapid price rebound.
Why Pricing Accuracy Still Determines Outcomes
Despite improving demand, pricing discipline continues to separate homes that sell from those that sit.
Cape Coral’s median sale-to-list ratio of 96.2% shows negotiation remains standard. Homes entering the market above recent comparable sales still face longer timelines and price reductions, even as overall activity improves.
Among featured communities, the contrast is clear:
- Cape Royal recorded a 42-day median DOM and 27% re-list rate, indicating strong alignment between sellers and buyer expectations.
- Tarpon Point posted a 60% re-list rate and 89.2% sale-to-list ratio, reflecting ongoing pricing resets in the luxury waterfront segment.
Improving demand rewards well-priced homes more quickly, but it does not compensate for overpricing.
Cape Coral Featured Communities
Sandoval
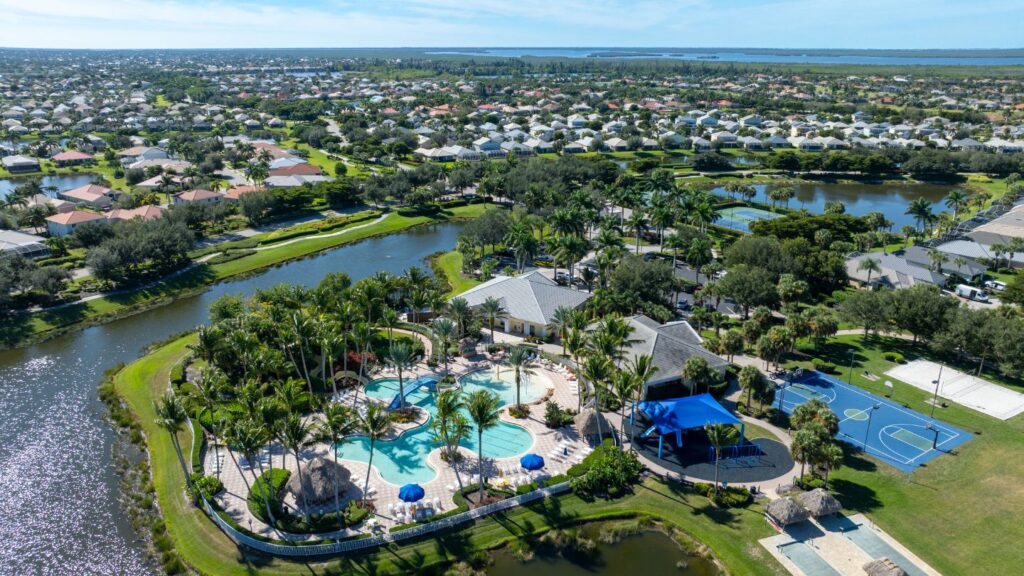
- Recent Activity: 18 sales in the past 120 days
- Pricing: Median sold $357,500 | Range $212,500–$668,000
- Home Types: Villas, townhomes, and single-family homes
- Market Snapshot: 10.4 months of supply | 118-day median DOM | 95.1% sale-to-list
Sandoval offers one of Cape Coral’s more accessible price points within a master-planned setting. Timelines are running longer than the city average, and about 28% of active listings previously came off market and returned. Fresh listings are moving faster than re-listed homes (72 vs 94 days), reinforcing the value of early pricing alignment.
Search homes for sale in Sandoval to compare current inventory with recent closed prices.
Cape Royal
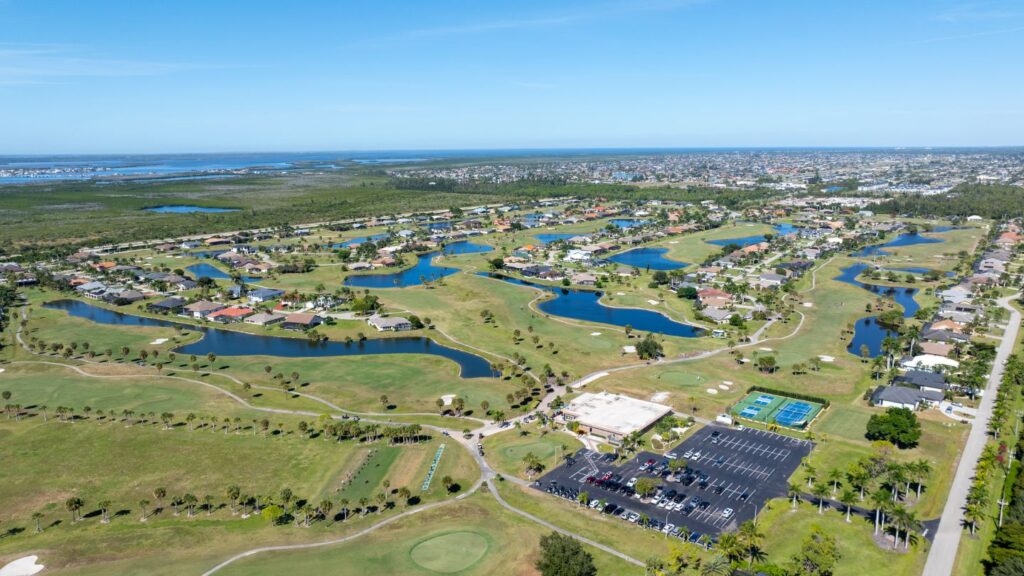
- Recent Activity: 7 sales in the past 120 days
- Pricing: Median sold $618,500 | Range $525,000–$900,000
- Home Types: Single-family homes in a golf course setting
- Market Snapshot: 8.6 months of supply | 42-day median DOM | 94.0% sale-to-list
Cape Royal is a smaller community with lower transaction volume, so individual sales carry more weight in the data. Among current listings, 27% previously came off market and returned. With only 7 closed sales in the lookback period, pricing decisions benefit from careful comparison to recent, highly similar properties.
Explore homes for sale in Cape Royal to see how current listings compare to recent sales.
Tarpon Point
- Recent Activity: 6 sales in the past 120 days
- Pricing: Median sold $953,500 | Range $525,000–$3,200,000
- Home Types: Waterfront condos and single-family homes
- Market Snapshot: 13.3 months of supply | 62-day median DOM | 89.2% sale-to-list
Tarpon Point currently shows the highest re-list rate among Cape Coral featured communities, with 60% of active listings having previously come off market and returned. The 89.2% sale-to-list ratio, the lowest among featured communities, indicates buyers are negotiating more aggressively here. With only 6 sales in the lookback period, the data reflects a slower pace of activity at higher price points.
View homes for sale in Tarpon Point to understand current pricing and negotiation trends.
Cape Harbour
- Recent Activity: 12 sales in the past 120 days
- Pricing: Median sold $880,000 | Range $425,000–$3,150,000
- Home Types: Marina condos, townhomes, and single-family homes
- Market Snapshot: 14.3 months of supply | 90-day median DOM | 95.2% sale-to-list
Cape Harbour offers waterfront living with direct boating access, reflected in its higher price points. Inventory levels remain elevated at 14.3 months of supply, and 37% of active listings previously came off market and returned. Timelines are running around 90 days, consistent with the luxury waterfront segment.
Search homes for sale in Cape Harbour to explore current marina community inventory.
Cape Coral Yacht Club
- Recent Activity: 6 sales in the past 120 days
- Pricing: Median sold $1,312,500 | Range $445,000–$3,300,000
- Home Types: Waterfront single-family homes near the yacht club
- Market Snapshot: 15.3 months of supply | 58-day median DOM | 92.4% sale-to-list
The Cape Coral Yacht Club area is operating with elevated inventory, currently at 15.3 months of supply, and 52% of active listings have previously come off market and returned. The 92.4% sale-to-list ratio points to meaningful negotiation. With only 6 closed sales in the lookback period, individual transactions have a significant influence on market statistics.
Explore homes for sale in Cape Coral Yacht Club to evaluate pricing relative to recent buyer activity.
What Cape Coral Buyers and Sellers Are Asking Right Now
Cape Coral remains buyer-leaning, with about 6.4 months of supply, but conditions are no longer static. Inventory has tightened meaningfully over the past year, and buyer activity has increased. Buyers still have leverage, but the advantage they enjoyed throughout 2024 is narrowing as more contracts are being written.
The largest part of the correction has already occurred. Prices are down roughly 19% from the 2022 peak, but year-over-year changes are now modest. Current data points to stabilization rather than continued broad declines, especially for homes priced in line with recent comparable sales.
Pricing accuracy is the difference. Across featured Cape Coral communities, re-list rates range from 27% to 60%. Homes priced to current market conditions tend to move closer to the city’s median timeline, while those priced above recent sales often sit longer or return to the market after adjustments.
Insurance has become one of the most common questions we hear from buyers and sellers. Higher premiums and flood considerations can slow demand in certain areas, particularly older homes or waterfront properties. Buyers are factoring these costs more carefully, and sellers are seeing stronger results when insurance and flood information is addressed early and transparently.
For buyers who are motivated by lifestyle, relocation, or long-term plans, current conditions remain favorable. Prices are below peak levels, inventory is still elevated by historical standards, and negotiation remains common. At the same time, rising pending sales suggest buyer competition may increase as the year progresses, especially for well-priced homes.
Final Thoughts
A year ago, Cape Coral looked like a market waiting for buyers to return. That wait appears to be ending. Pending sales are up sharply, inventory has tightened, and closed sales are increasing.
For buyers, Cape Coral offers value relative to peak pricing with selection that remains strong by historical standards. For sellers, the market continues to reward pricing accuracy. Demand is present, but it’s going to homes priced to align with what buyers are seeing across the market.
If you’d like to understand how these trends apply to your neighborhood or timeline, we’re here to help.
Most homeowners feel overwhelmed when it’s time to move. At Worthington Realty, we provide personalized guidance and clear communication so that you feel heard, valued, and confident in your decisions.
Methodology: This analysis draws from Florida Gulf Coast MLS data, including InfoSparks aggregate statistics (January 2021–January 2026), transaction-level data from featured Cape Coral communities, and a re-list analysis identifying properties that previously expired, terminated, or withdrew within the past 12 months.